Every map in the atlas.
Earth
Relief, oceans, rivers, ice, plates and the shape of the land.
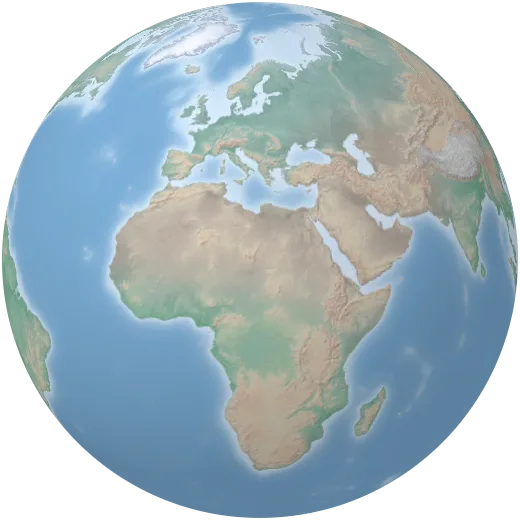
Physical map
The classic atlas view: land coloured by height, from green lowlands to brown highlands and white peaks, with shaded relief and the sea floor.
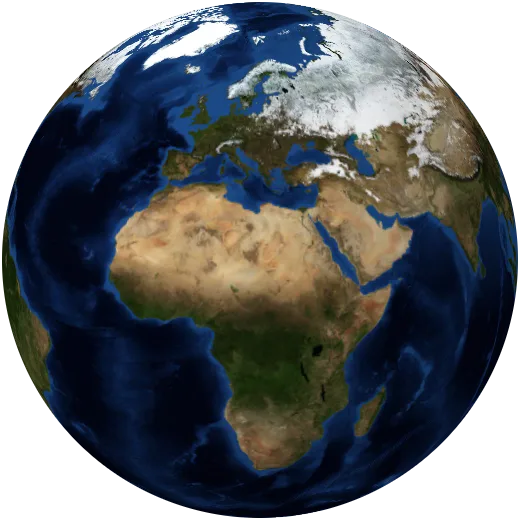
Satellite view
A cloud-free mosaic of the whole planet as seen from space, stitched together from a year of NASA satellite images.
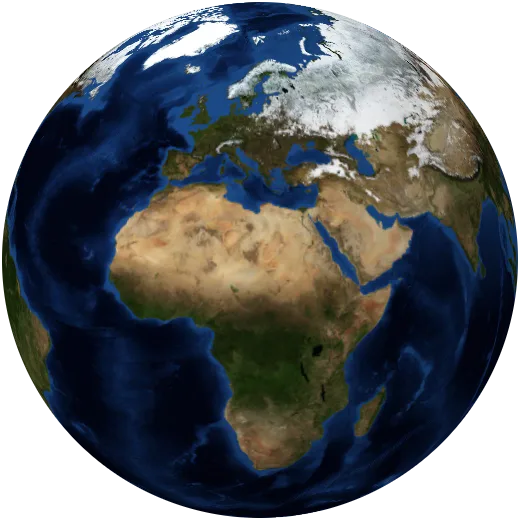
Day and night
Where the sun is shining at this moment. The line between day and night moves 15° west every hour; on the dark side, city lights come on.
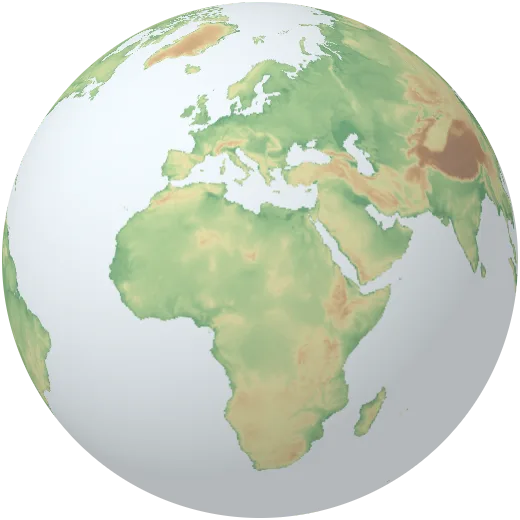
Elevation
Height of the land above sea level. The relief is raised so mountain ranges stand out from the globe.
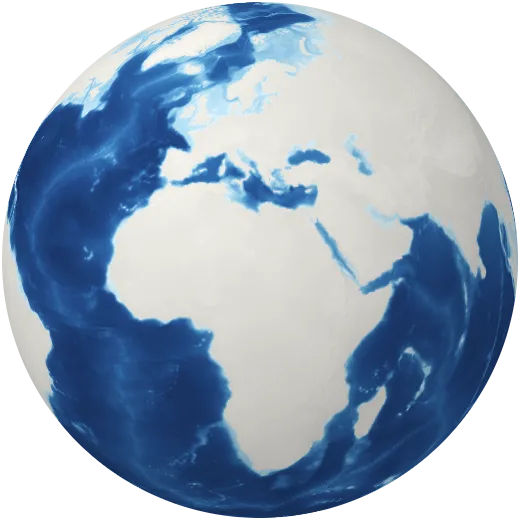
Ocean depth
The shape of the sea floor: continental shelves, mid-ocean ridges and trenches more than 10 kilometres deep.
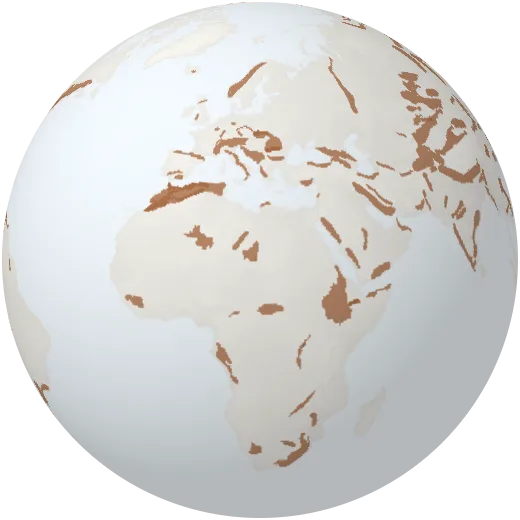
Mountain ranges
The great mountain ranges of the world, from the Himalayas and Andes to the Alps, Rockies and Urals.
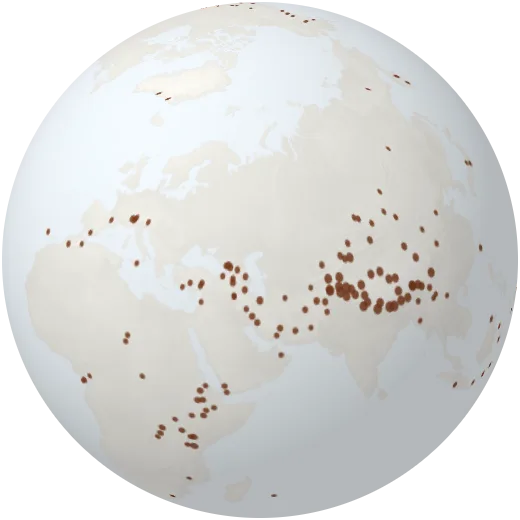
Highest peaks
Named summits with their height. Everest stands at 8,849 metres; dozens of others pass 7,000.
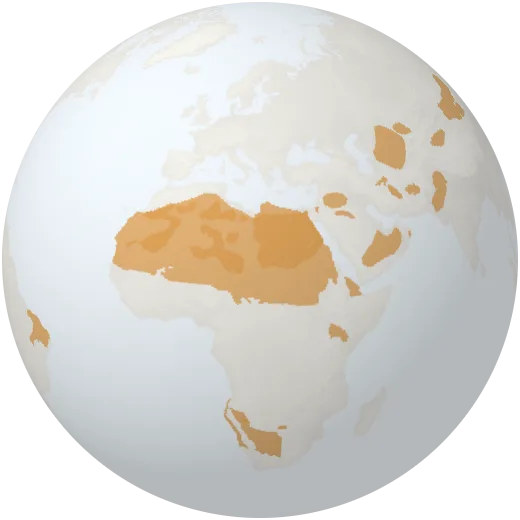
Deserts
Named deserts of the world. The Sahara alone is about as large as the United States.
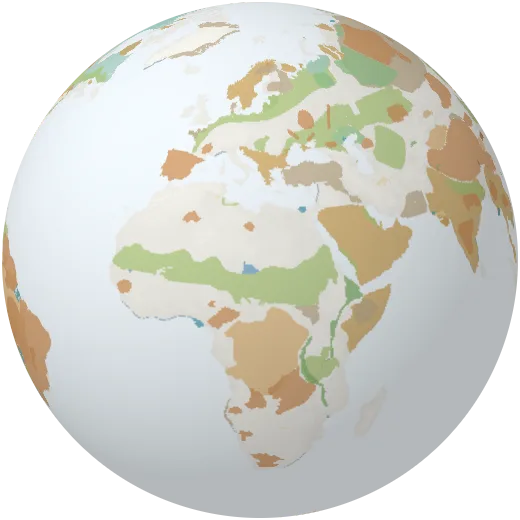
Landforms
Plateaus, plains, basins, deltas, peninsulas, salt flats and other named regions of the land.
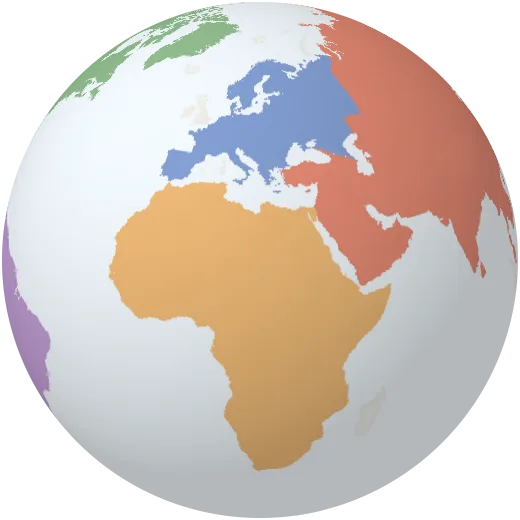
Continents
The seven continents as they are usually drawn: Africa, Antarctica, Asia, Australia, Europe, North America and South America.
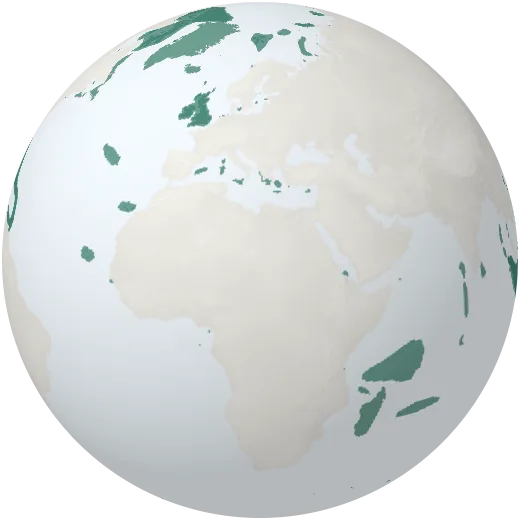
Islands
Named islands and archipelagos, from Greenland, the largest island on Earth, to remote Pacific atolls.
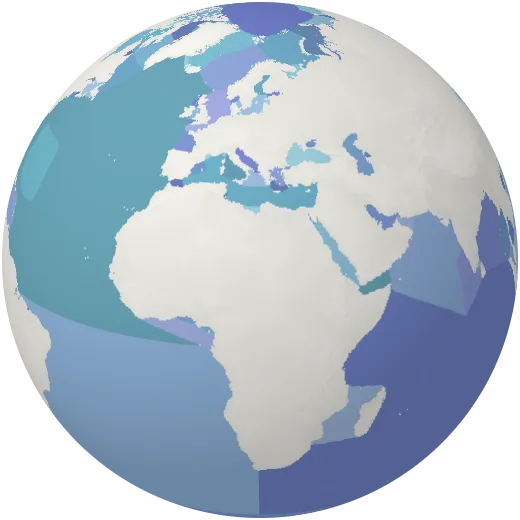
Oceans and seas
The five oceans and every named sea, gulf, bay and strait.
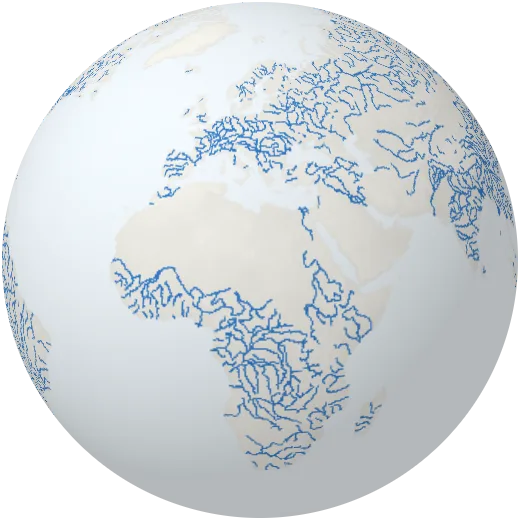
Rivers
The major rivers of the world, drawn flowing. The Nile and the Amazon each run more than 6,400 kilometres.
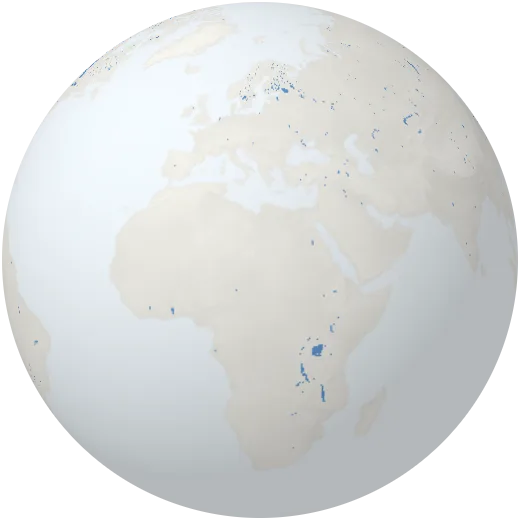
Lakes and reservoirs
Natural lakes, salt lakes and reservoirs behind dams. The Caspian Sea is the largest lake on Earth.
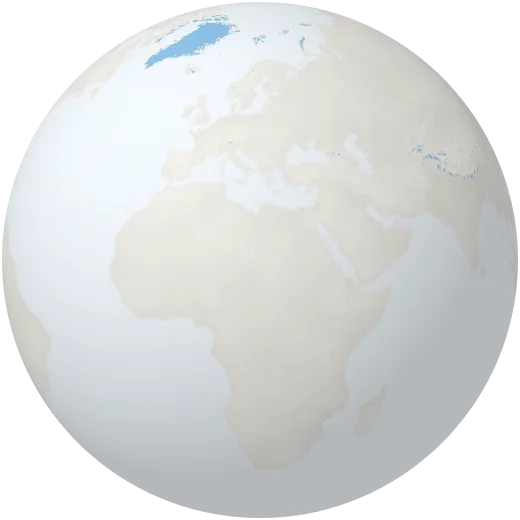
Glaciers and ice sheets
Permanent ice on land and the floating ice shelves of Antarctica. Together they hold about two thirds of the world’s fresh water.
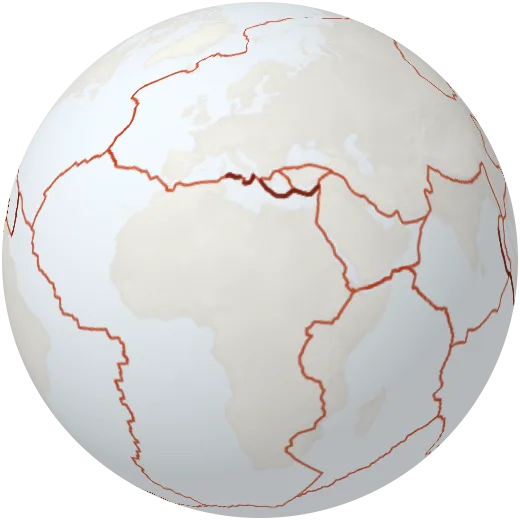
Tectonic plates
The rigid plates that make up Earth’s outer shell. Where they collide, pull apart or slide past each other, earthquakes and volcanoes follow.
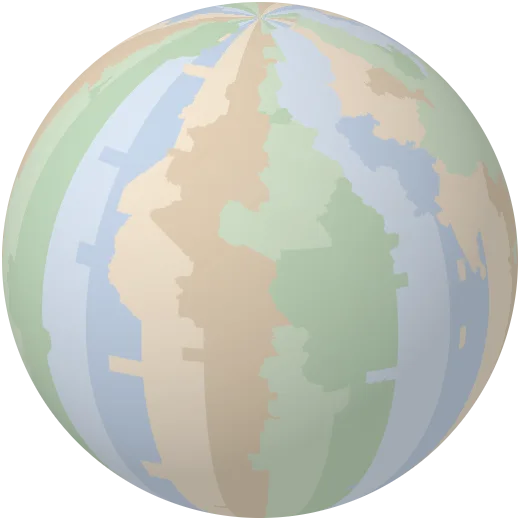
Time zones
The world’s standard time zones, measured from Coordinated Universal Time (UTC). Daylight saving time is not shown.
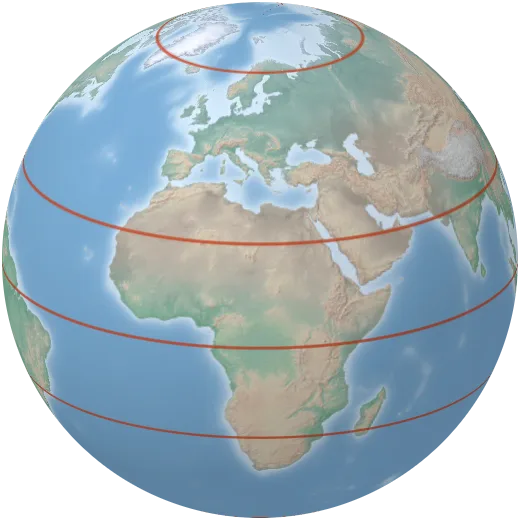
Equator, tropics and polar circles
The equator, the Tropics of Cancer and Capricorn, the Arctic and Antarctic circles and the International Date Line.
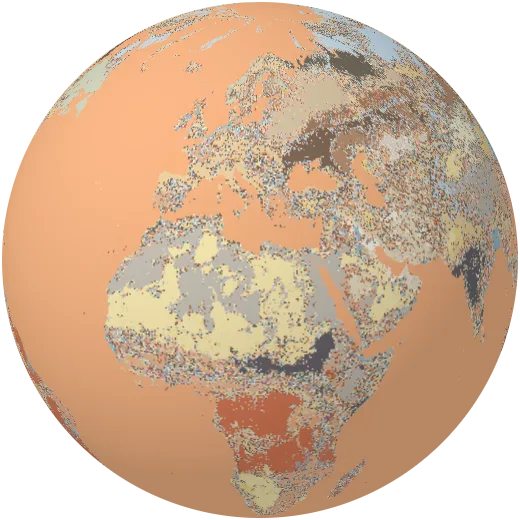
Soils
The most likely soil group everywhere on Earth, from dark fertile chernozems on the steppes to red, weathered ferralsols in the tropics (SoilGrids 2.0, World Reference Base).
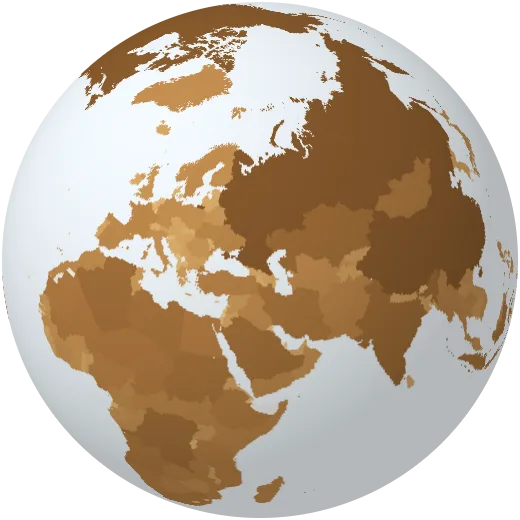
Land area
Land area of each country. Russia is larger than Pluto’s surface.
Climate
Temperature, rain, seasons, winds, currents and climate zones.
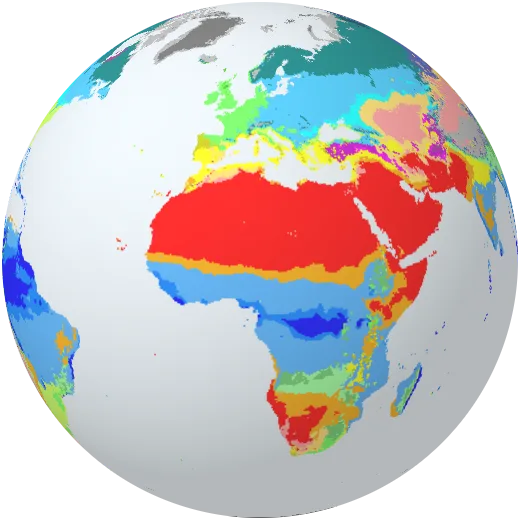
Climate zones
The Köppen–Geiger classification sorts every place by its temperature and rainfall through the year, from tropical rainforest to ice cap. Computed by Orbis from WorldClim normals.
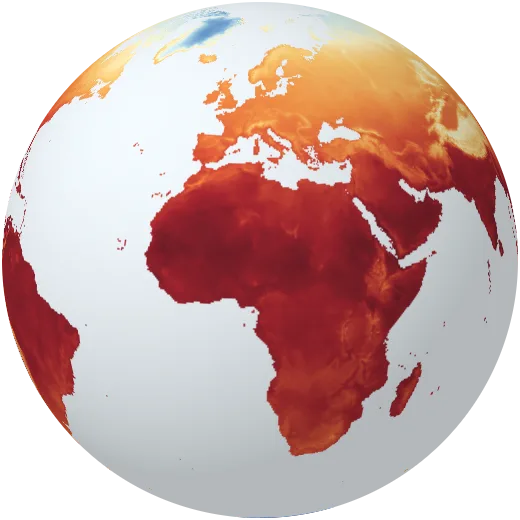
Average temperature
Mean air temperature over the whole year, 1970–2000. Siberia averages below −15 °C; parts of the Sahara pass 30 °C.
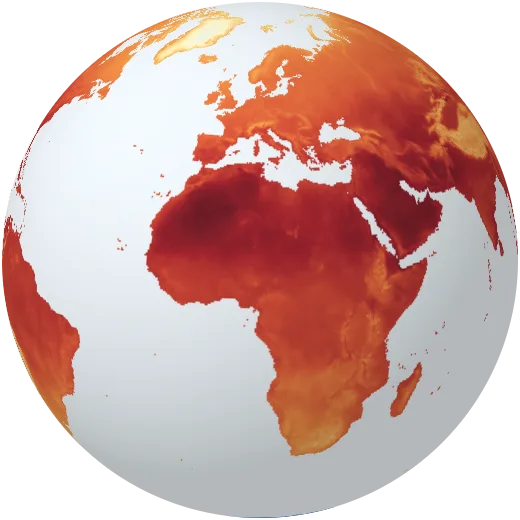
Temperature through the year
Average temperature month by month. Watch the northern continents freeze and thaw while the tropics barely change.
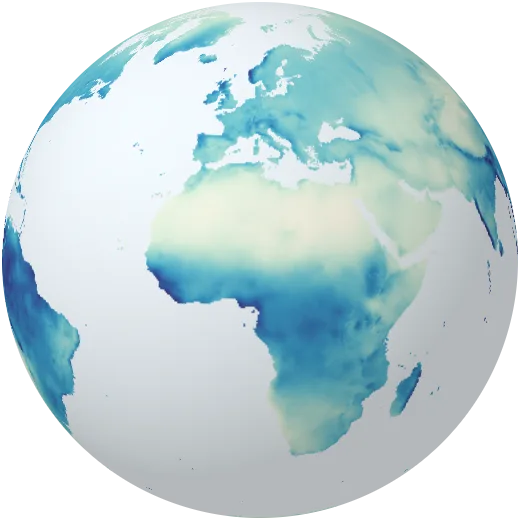
Rainfall
Total rain and snow in an average year. The wettest places get more than 10 metres; the driest almost nothing.
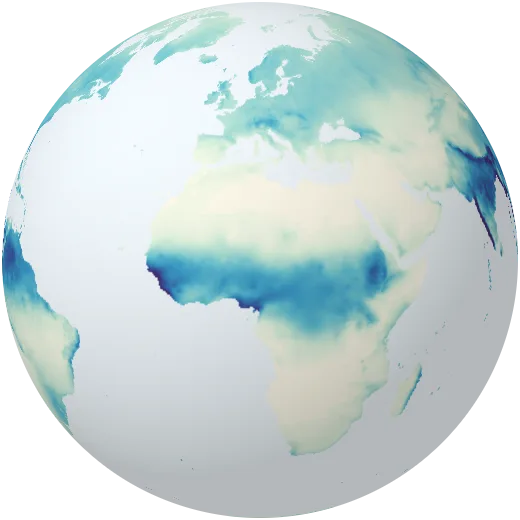
Rain through the year
Monthly rainfall. The monsoon sweeps over South Asia in summer and the rain belt of the tropics follows the sun north and south.
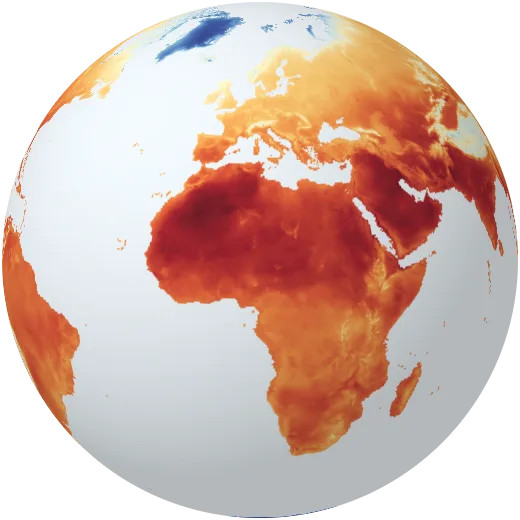
Hottest month
Average daily maximum temperature in the warmest month of the year.
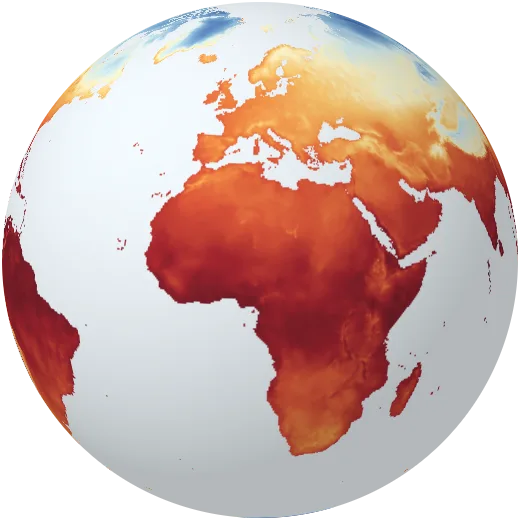
Coldest month
Average daily minimum temperature in the coldest month of the year.
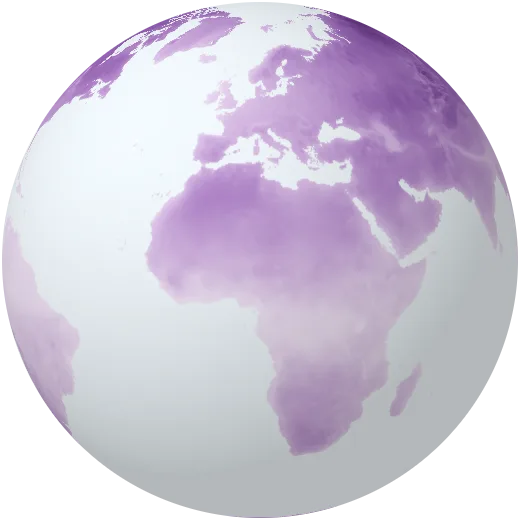
Summer–winter difference
How far apart the hottest and coldest months are. Far from the sea, in Siberia, the gap passes 60 °C.
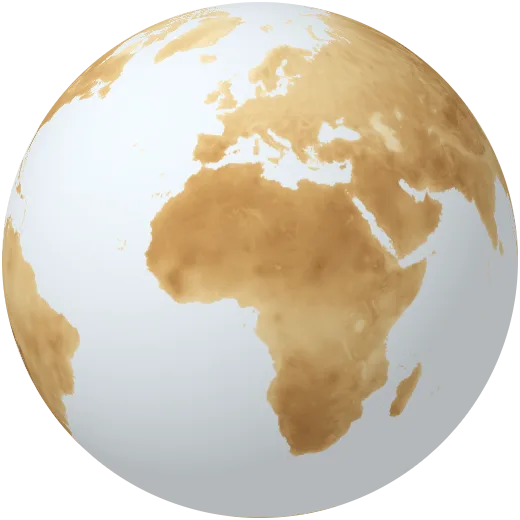
Day–night difference
The average difference between day and night temperatures. Deserts and high plateaus swing the most.
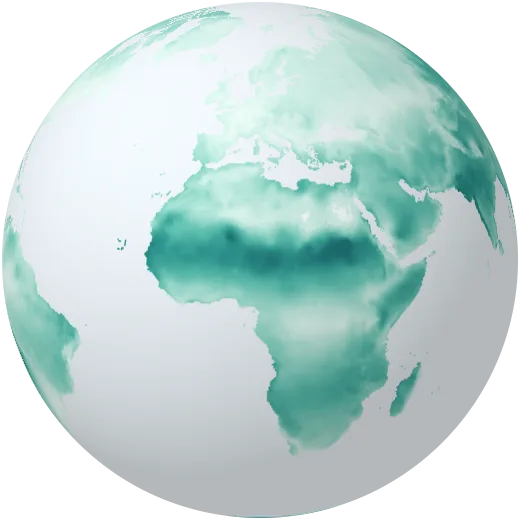
Rain seasonality
How unevenly rain falls through the year. High values mean almost all rain arrives in a short wet season.
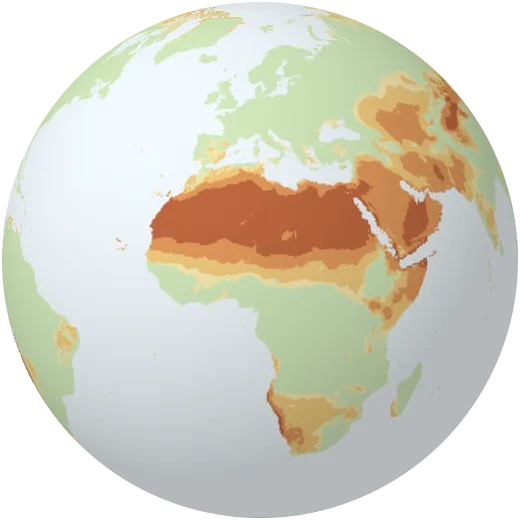
Drylands
Aridity: how much rain falls compared with how much water the air could take up. About 40% of the land is dryland. Computed by Orbis from WorldClim (Thornthwaite method).
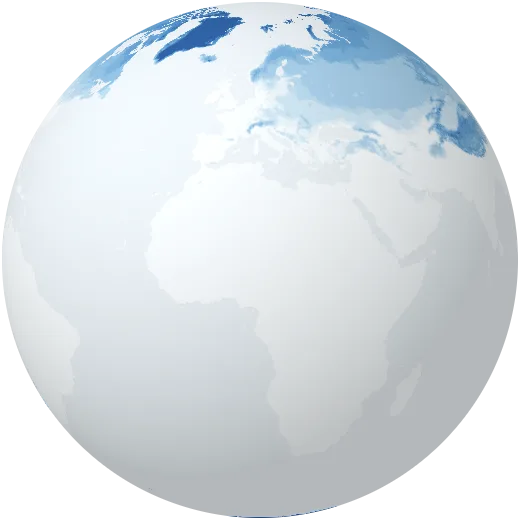
Frozen months
Number of months with an average temperature below freezing.
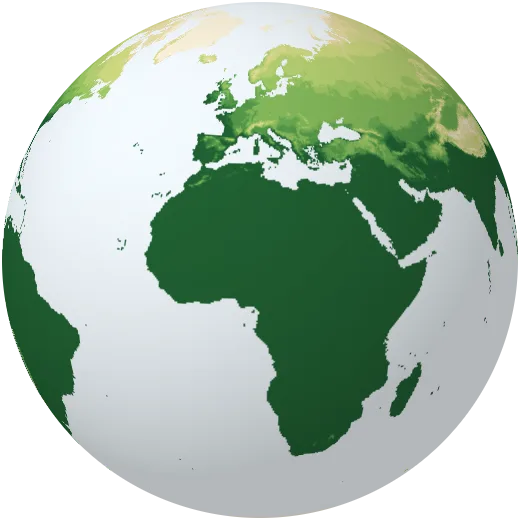
Growing season
Number of months warm enough (5 °C or more on average) for most plants to grow.
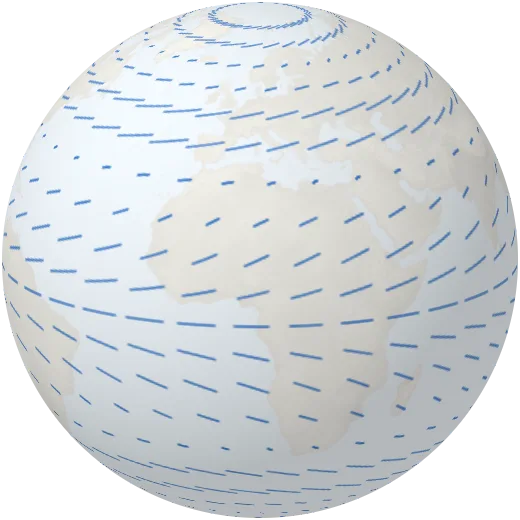
Prevailing winds
The great wind belts: easterly trade winds near the equator, westerlies in the mid-latitudes and polar easterlies. Shown as a simplified circulation model.
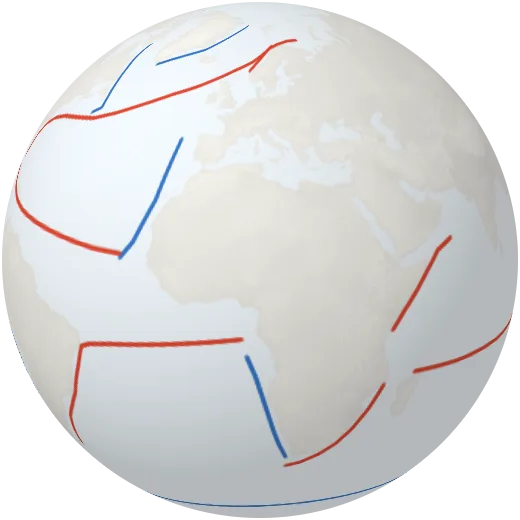
Ocean currents
The major surface currents. Warm currents like the Gulf Stream carry heat towards the poles; cold currents flow back towards the equator.
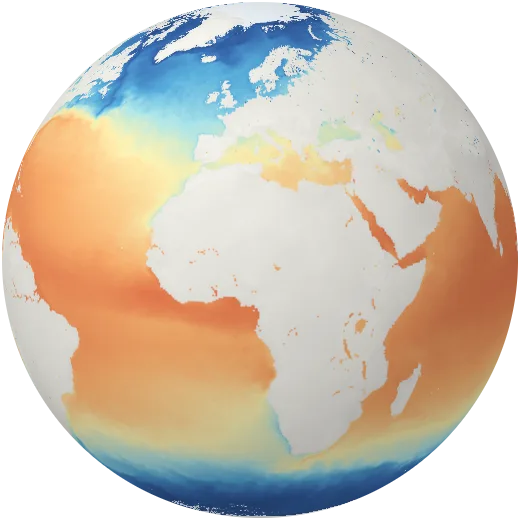
Sea surface temperature
Temperature of the ocean surface. Warm pools near Indonesia pass 30 °C; polar seas sit near −2 °C.
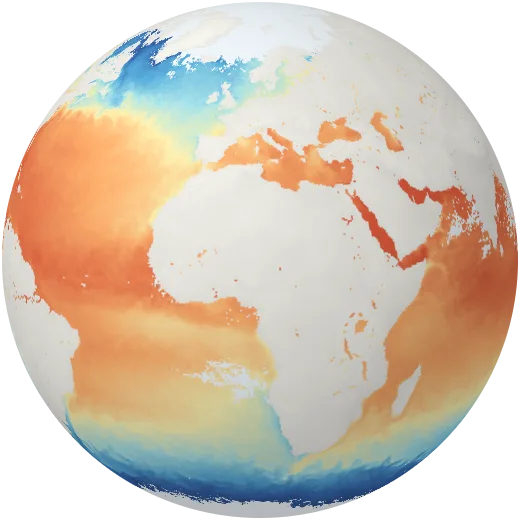
Ocean temperature through the year
Monthly sea surface temperature for 2024, the warmest year on record for the oceans.
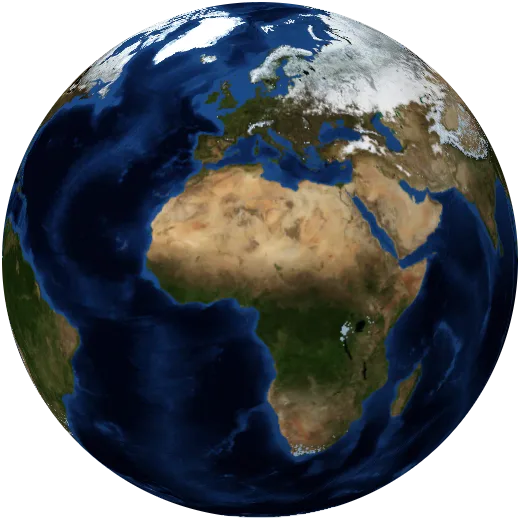
Snow through the year
Monthly snow cover in 2024. In January snow covers almost half of the northern hemisphere’s land.
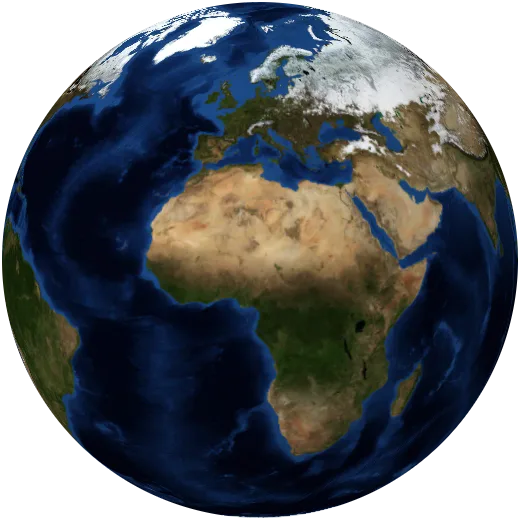
Sea ice
Arctic and Antarctic sea ice at its March and September extremes in 2025. The Arctic’s September ice has shrunk by about a third since 1979.
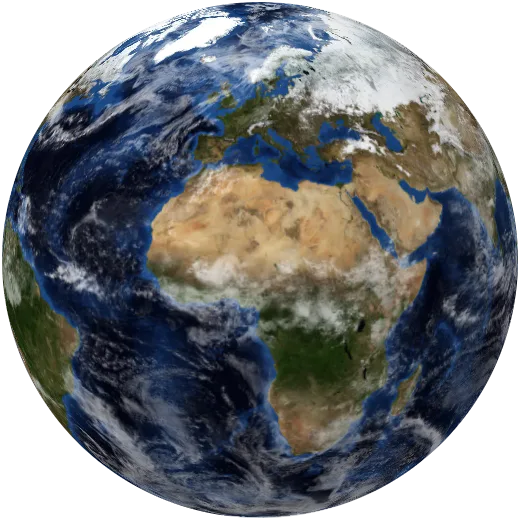
Clouds
A global picture of cloud cover stitched together from satellite passes.

Ozone layer
Total ozone in early October 2024. The hole over Antarctica is slowly healing since CFCs were banned under the 1987 Montreal Protocol.
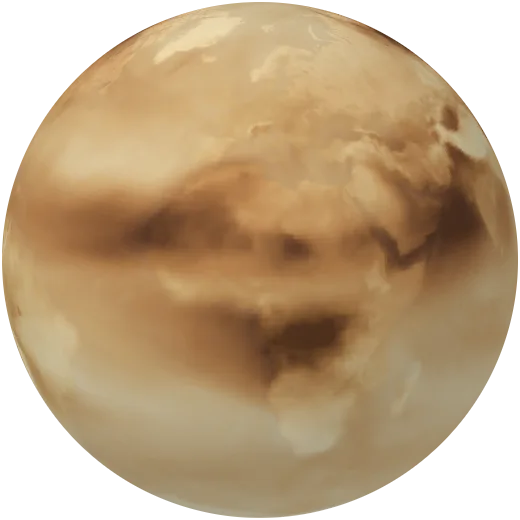
Dust, smoke and haze
Aerosols in the air through 2024: Saharan dust blowing over the Atlantic, smoke from fires, and haze over industrial regions.
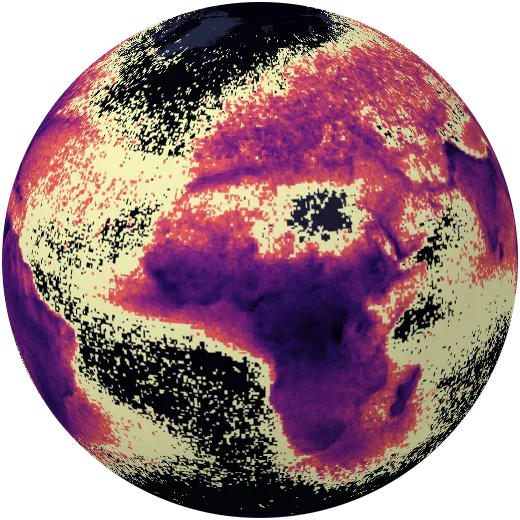
Lightning
How often lightning strikes each square kilometre in an average year, measured from space between 1995 and 2013. Lake Maracaibo in Venezuela is the world’s lightning capital.
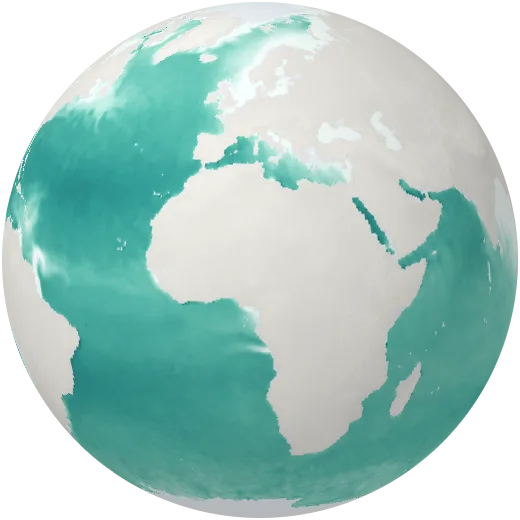
Ocean salinity
How salty the sea surface is, measured by NASA’s SMAP satellite. Evaporation makes the subtropical Atlantic saltiest; big rivers and rain freshen the sea.
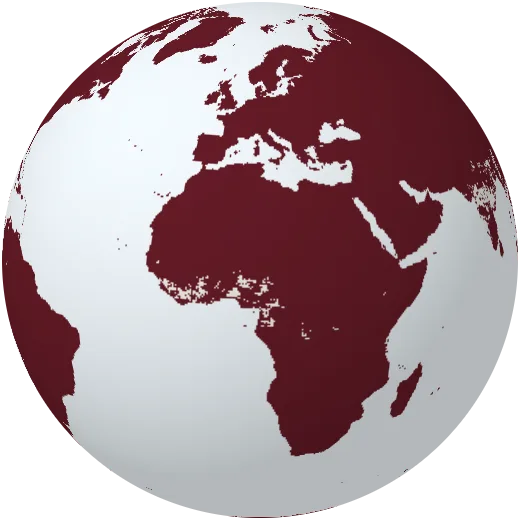
Ground temperature
How hot the ground itself gets in the afternoon in January and in July 2024, measured by satellite. Desert surfaces pass 60 °C in summer.
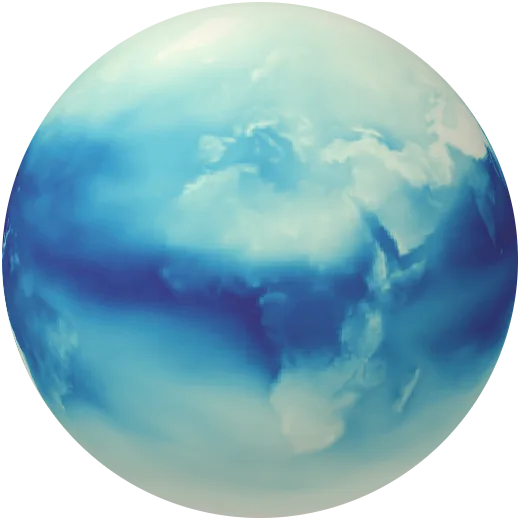
Water vapour
All the water held in the air above each place, as if it fell as rain. Water vapour is the main greenhouse gas and the fuel of storms.
Life
Biomes, forests, grasslands, oceans and the richness of species.
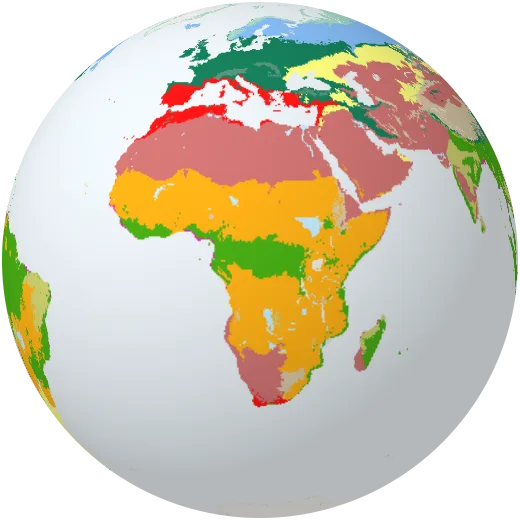
Biomes
Fourteen biomes: large communities of plants and animals shaped by climate, from tropical rainforest to tundra.
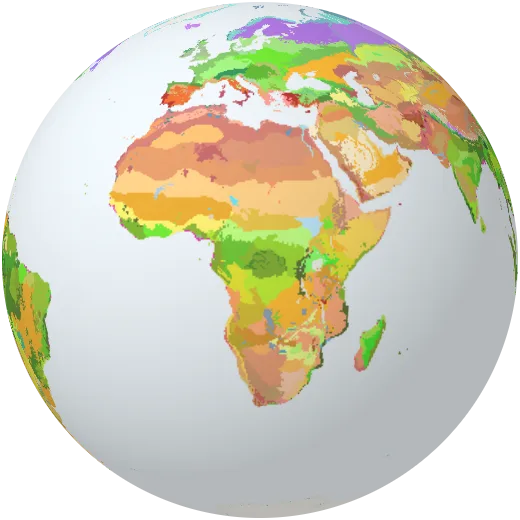
Ecoregions
846 ecoregions, each with its own mix of species, from the Sundarbans mangroves to the Namib desert.
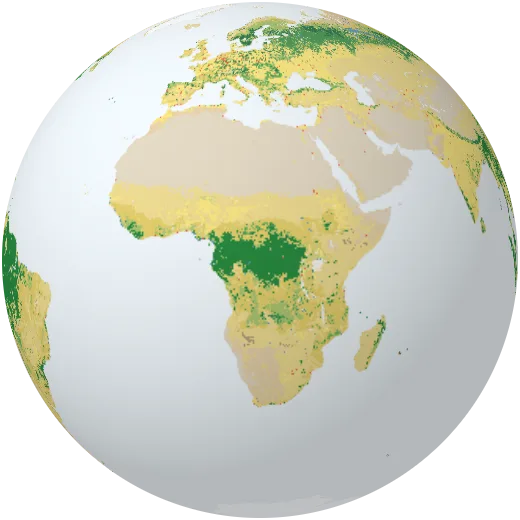
Land cover
What covers the ground everywhere on Earth, classified from MODIS satellite images for 2023.
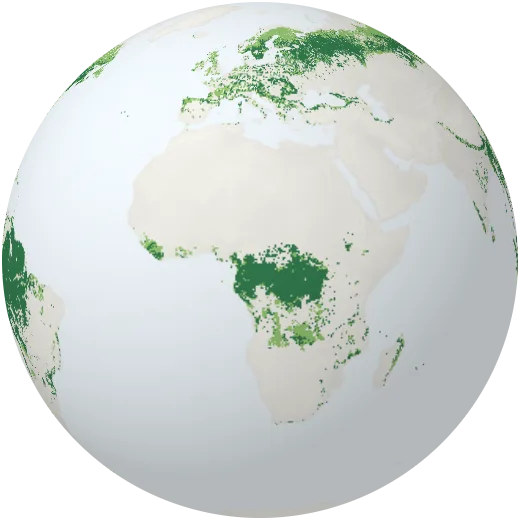
Forests
Where the world’s forests grow: tropical rainforest along the equator, temperate woodland and the vast boreal forest of the north. Forests cover about 31% of the land.
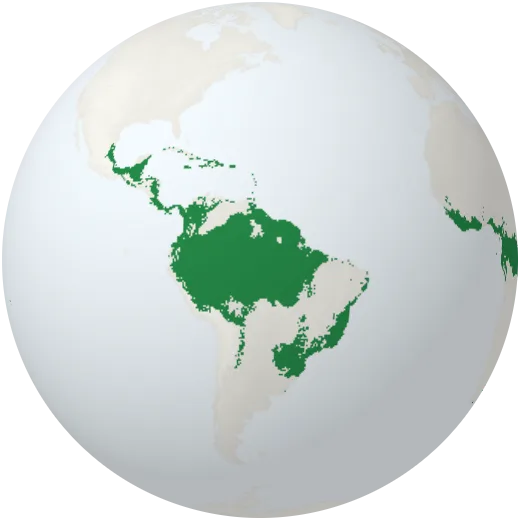
Tropical rainforests
Tropical and subtropical moist forests: the Amazon, the Congo basin and Southeast Asia. They hold more than half of all land species.
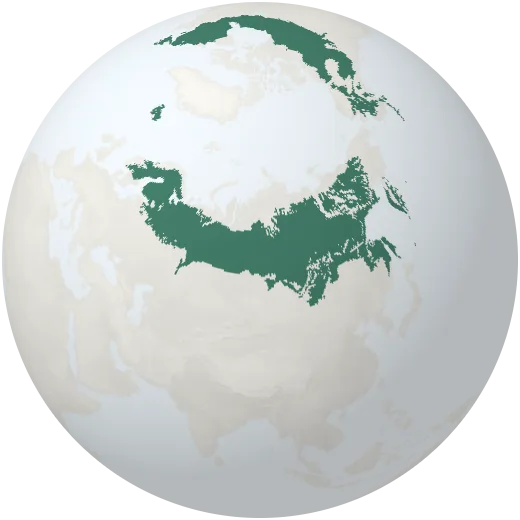
Boreal forest
The taiga: the largest land biome, a belt of conifers across Canada, Scandinavia and Russia.
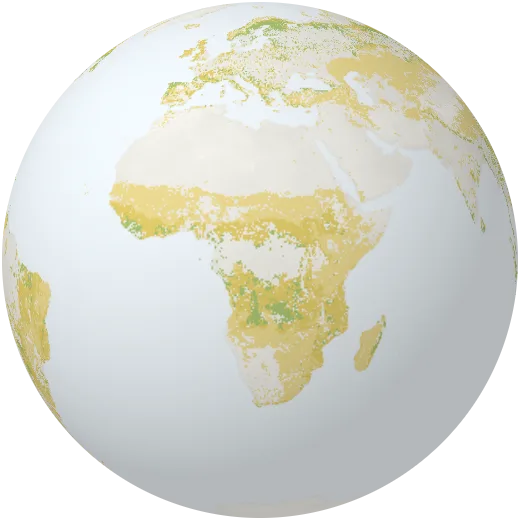
Grasslands and savannas
Open landscapes of grass with scattered trees: the savannas of Africa, the steppes of Asia and the prairies and pampas.
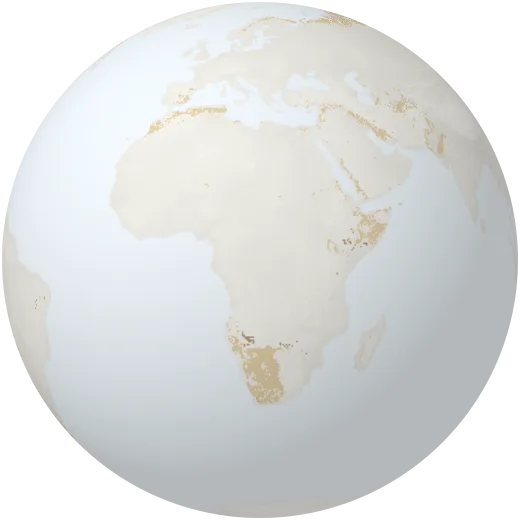
Shrublands
Land dominated by bushes and low woody plants, common at the edges of deserts and in Mediterranean climates.
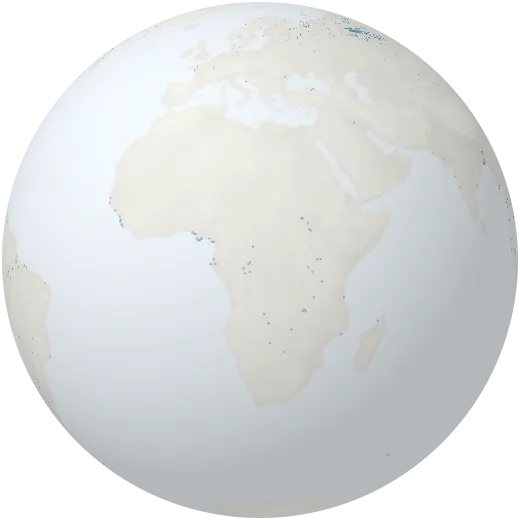
Wetlands
Permanent marshes, swamps and bogs, such as the Pantanal, the Sudd and the peatlands of Siberia and Canada.
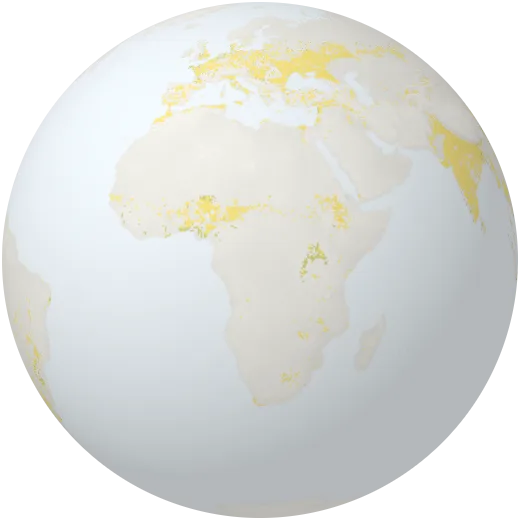
Farmland
Land used to grow crops. Farming covers about 12% of the ice-free land; pasture for animals takes about twice as much.
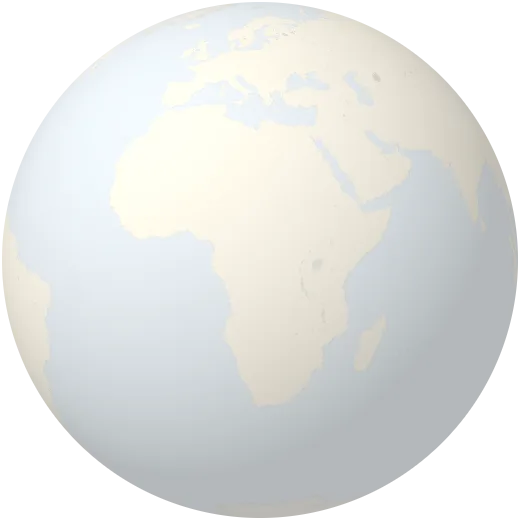
Cropland intensity
Share of each area planted with crops around the year 2000, from census data and satellites.
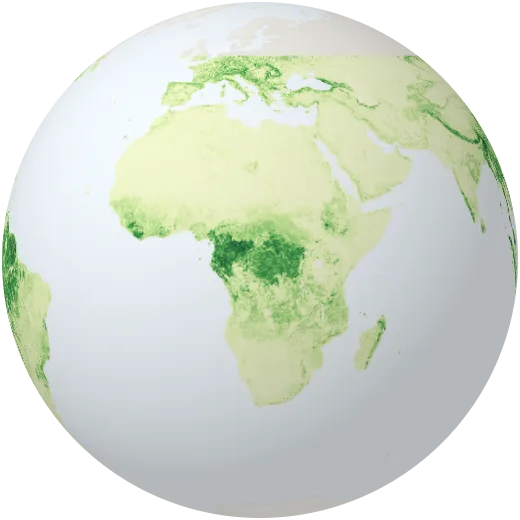
Tree height
Average height of the forest canopy, measured by a laser on the International Space Station (GEDI, 2019–2023). The tallest forests pass 40 metres.
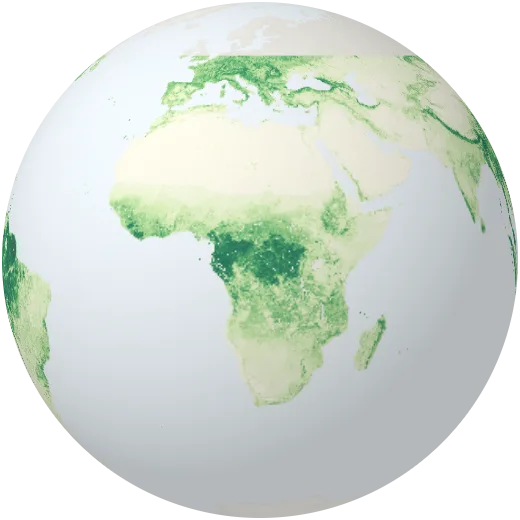
Carbon in forests
Above-ground biomass of trees and plants, measured from space by GEDI (2019–2023). About half of this mass is carbon pulled from the air.
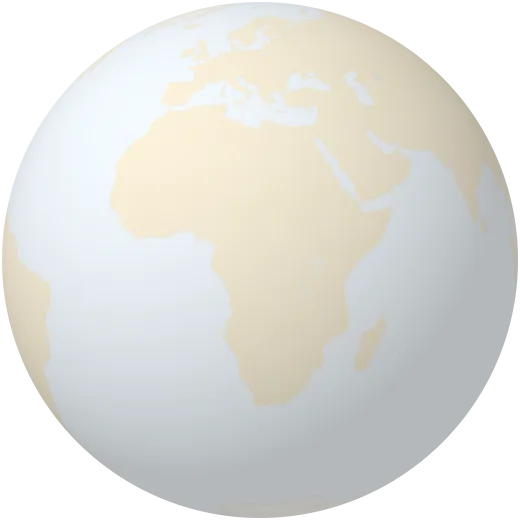
Pasture
Share of land used to graze cattle, sheep and goats around the year 2000. Pasture is the largest human use of land.
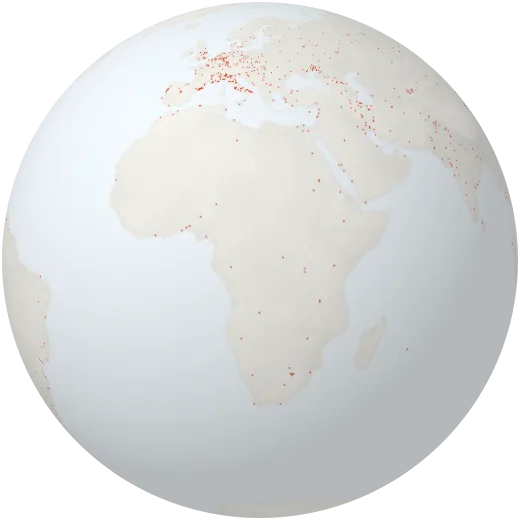
Urban areas
The built-up footprint of towns and cities, mapped from satellite images.
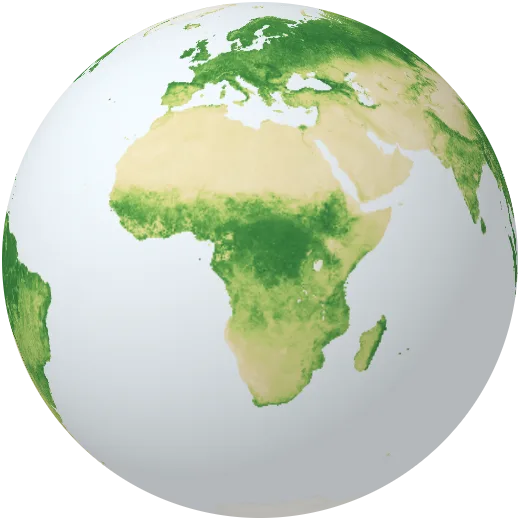
Plants through the year
How green the land is, month by month in 2024 (NDVI). The northern hemisphere turns green each spring and fades each autumn: the planet breathing.
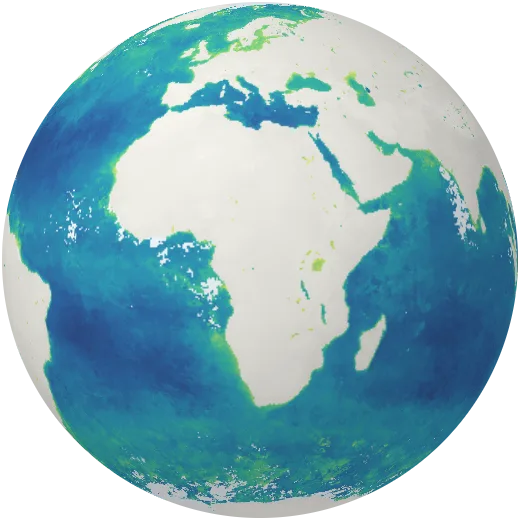
Ocean plankton
Chlorophyll in the sea, a sign of phytoplankton: tiny algae that make about half of the oxygen on Earth. Rich waters line the coasts and cold upwelling zones.
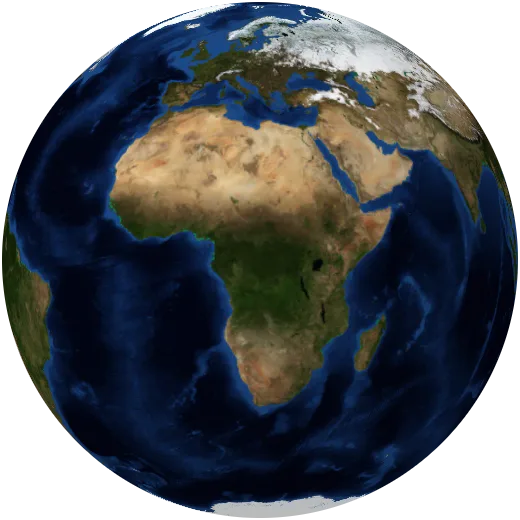
Mangroves
Salt-tolerant coastal forests of the tropics. Mangroves protect coasts from storms and store several times more carbon per hectare than inland forests.
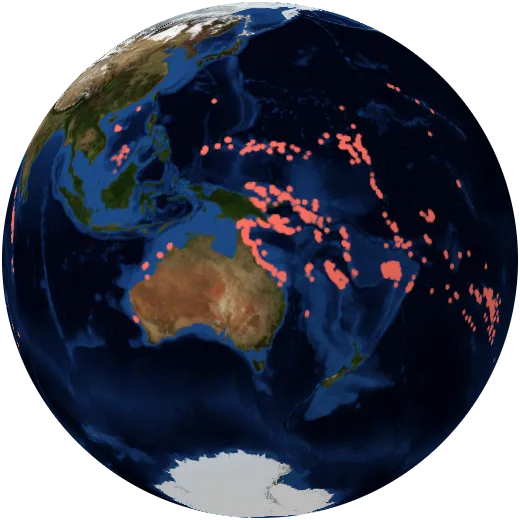
Coral reefs
Coral reefs cover less than 1% of the sea floor but shelter about a quarter of all marine species. Warming seas are bleaching them.
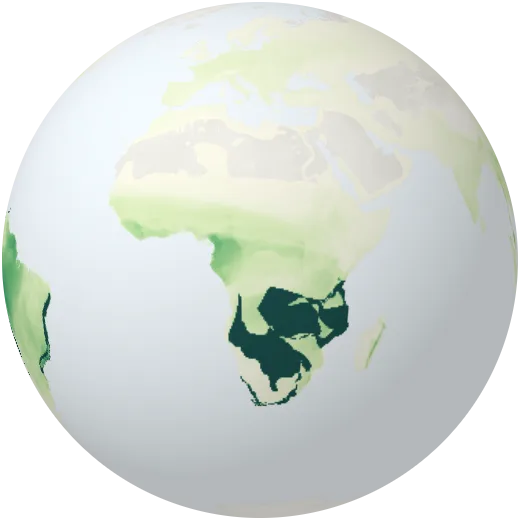
Amphibian species
Number of frog, toad and salamander species living in each area. The Amazon and the Andes are the world’s richest.
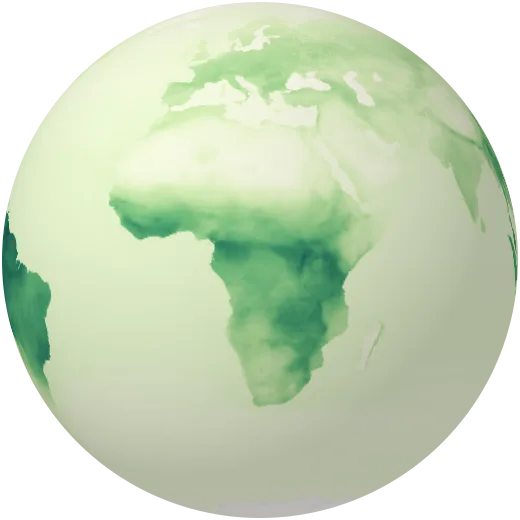
Mammal species
Number of mammal species whose range covers each area. Biodiversity peaks in the tropical forests and mountains of East Africa and the Amazon.
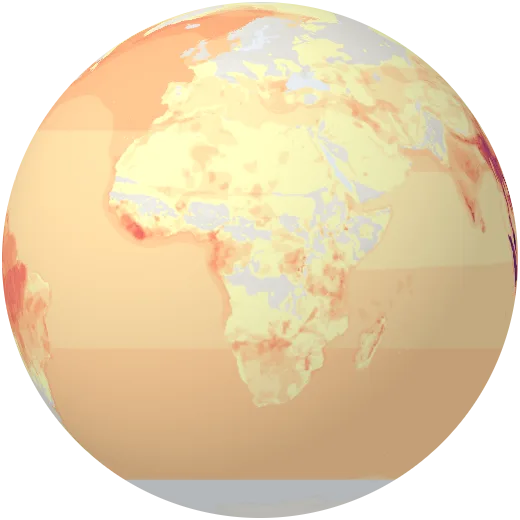
Threatened mammals
Number of mammal species listed as vulnerable, endangered or critically endangered by the IUCN in each area.
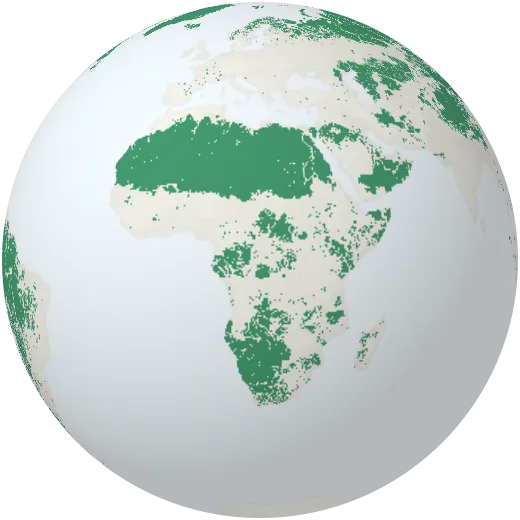
Last of the wild
The largest, least-touched natural areas left in each biome, where the human footprint is lowest.
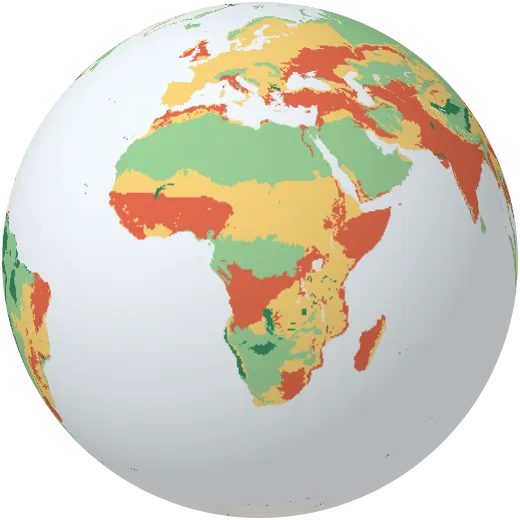
State of nature
How much natural habitat each ecoregion still has, and whether half of it could be protected (the “Nature Needs Half” assessment).
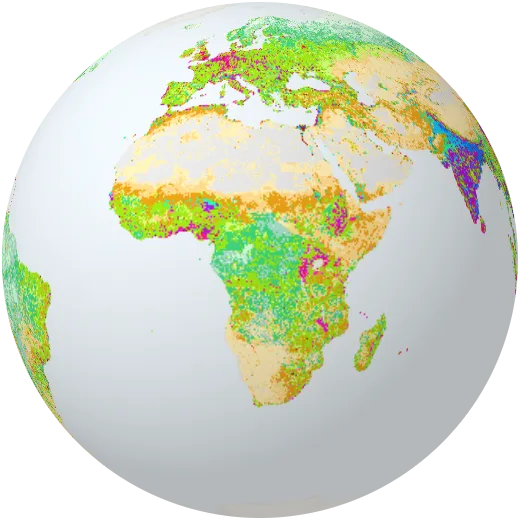
Human-shaped land
Anthromes: the world sorted by how people use and live on the land, from dense settlements to remote wild forest.
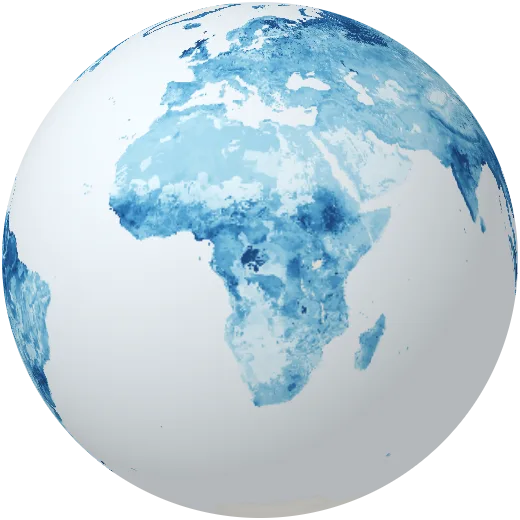
Soil moisture
How much water the top metre of soil holds, from NASA’s SMAP satellite (August 2025). Dry soils mean stressed crops and a higher fire risk.
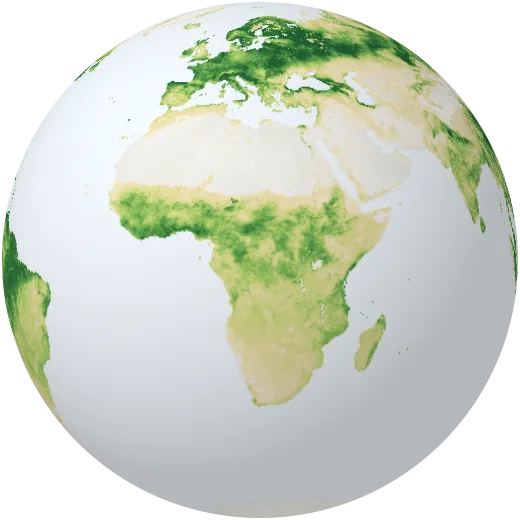
Plant growth
How much carbon plants pull from the air through photosynthesis each day, in mid-July 2025, from NASA’s SMAP carbon model.
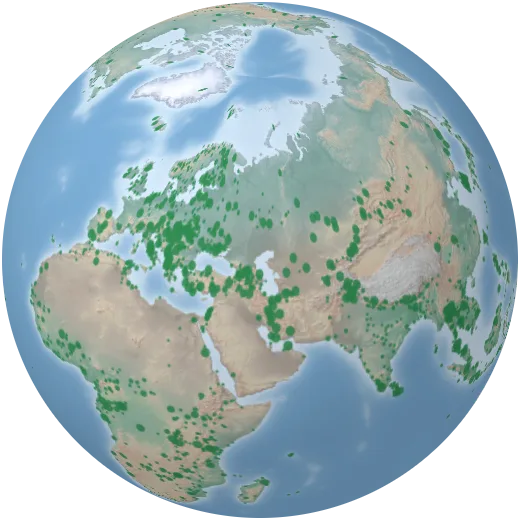
National parks
More than 3,000 national parks, from Yellowstone, the first in 1872, to the marine parks of the Pacific.
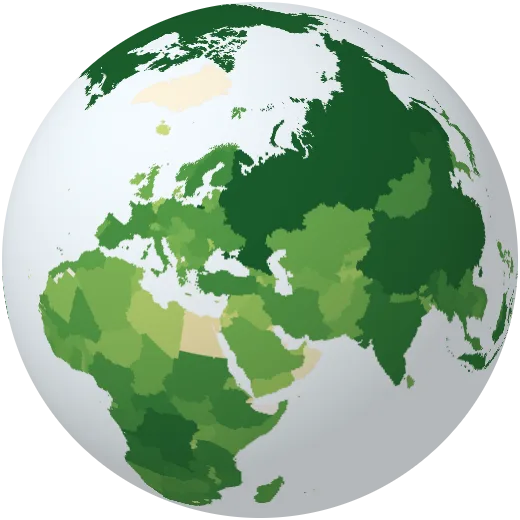
Forest area
Area covered by forest in each country.
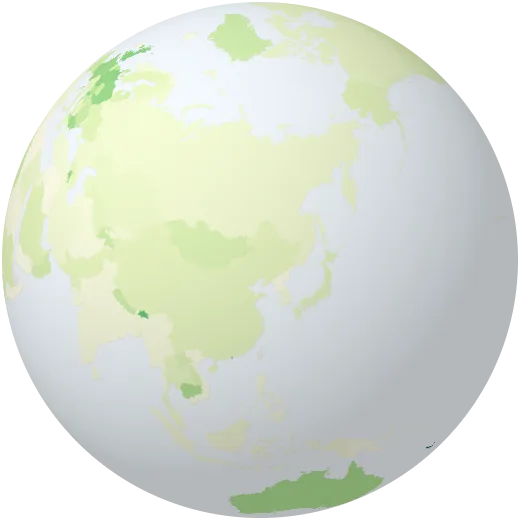
Protected land and sea
Share of a country’s land and waters set aside as protected areas.
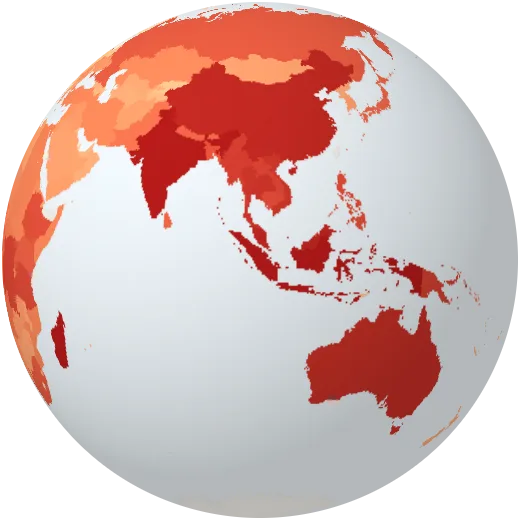
Threatened mammals
Mammal species at risk of extinction.
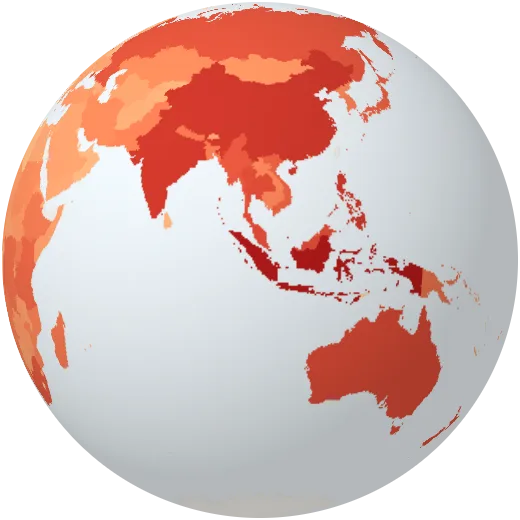
Threatened birds
Bird species at risk of extinction.
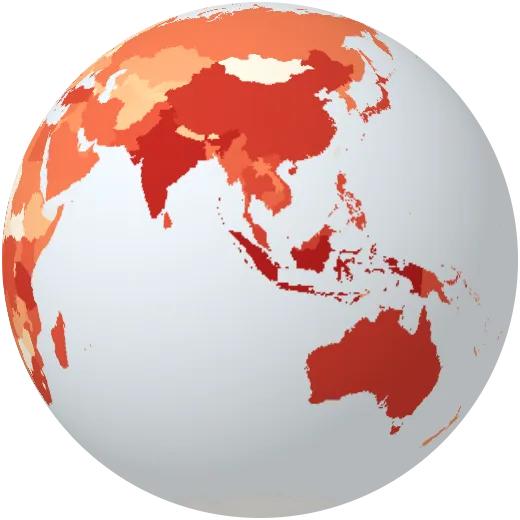
Threatened fish
Fish species at risk of extinction.
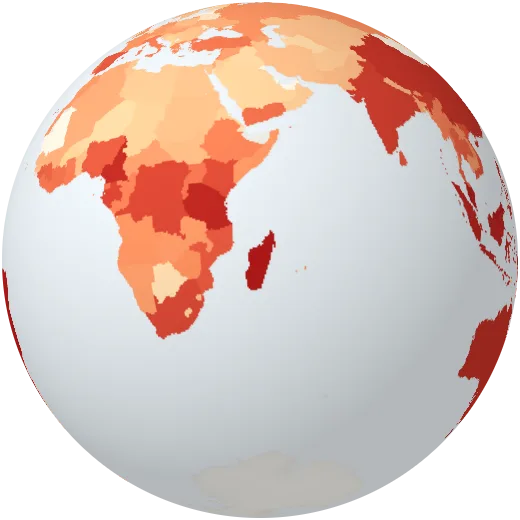
Threatened plants
Higher plant species at risk of extinction.
People
Where we live, how long we live, what we speak and how we connect.
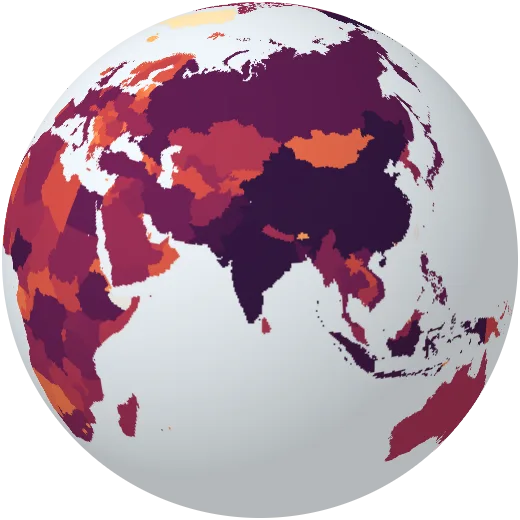
Population
People living in each country. India and China each pass 1.4 billion; together they hold more than a third of humanity.
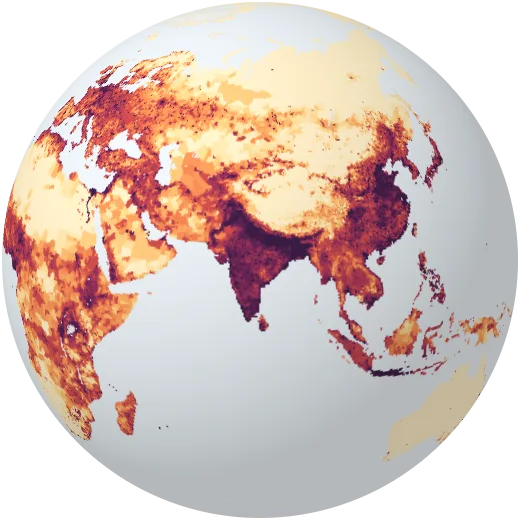
Where people live
People per square kilometre, from census counts for every district on Earth, 2000 to 2020.
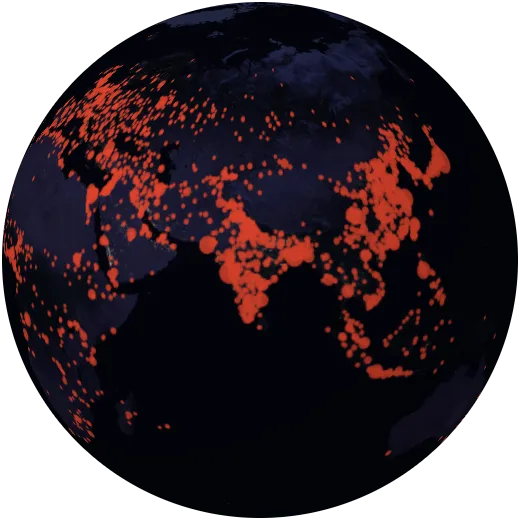
Cities
More than 7,000 cities sized by population. In 1950 there were two cities of ten million people; today there are more than thirty.
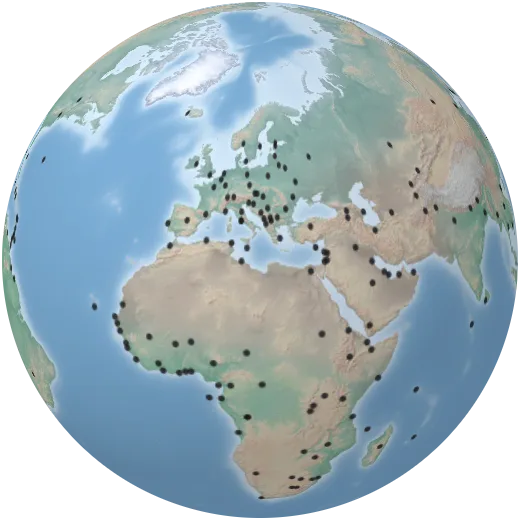
Capital cities
The capital of every country and territory.
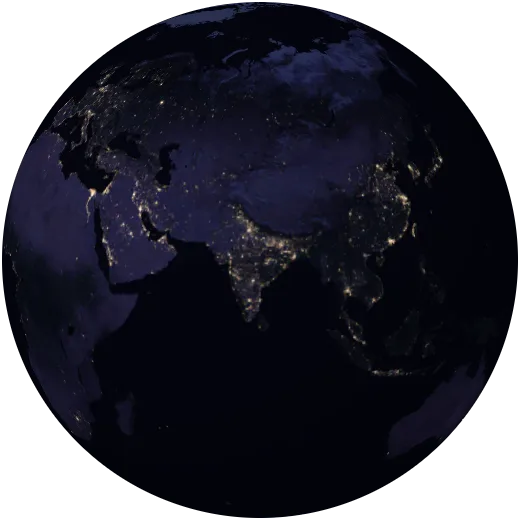
Earth at night
Lights seen from space at night in 2016. They trace cities, highways, gas flares and fishing fleets, and the places without electricity.
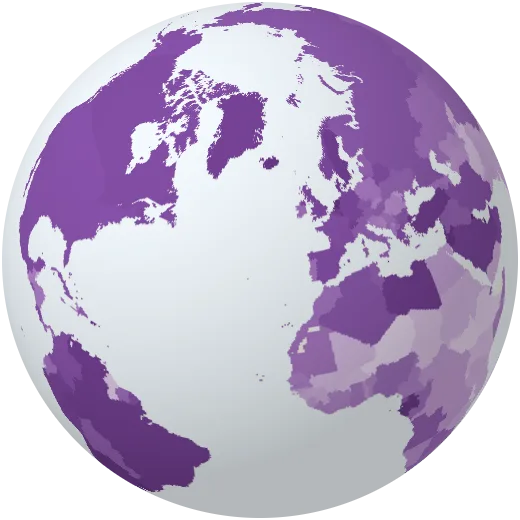
Urbanisation
Share of people who live in towns and cities. Worldwide it passed half in 2007.
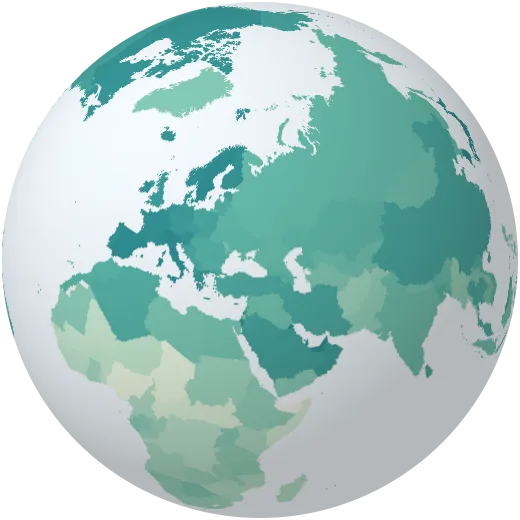
Life expectancy
How long a newborn can expect to live. It ranges from the mid-50s to the mid-80s depending on where a child is born.
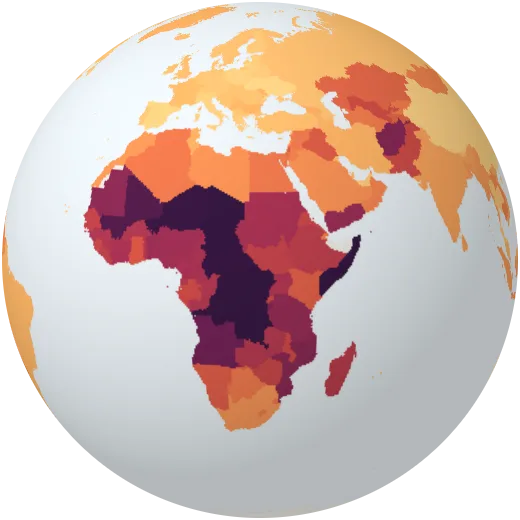
Children per woman
Average number of children a woman has in her life. Below about 2.1, a population shrinks in the long run unless people move in.
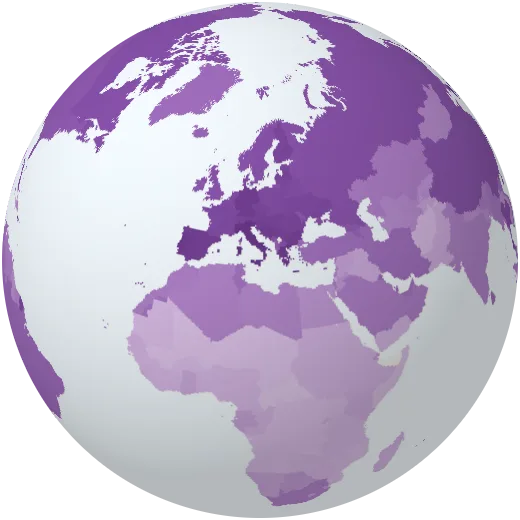
Median age
Half the population is older, half younger. Japan and much of Europe are near 45–50; Niger is under 16.
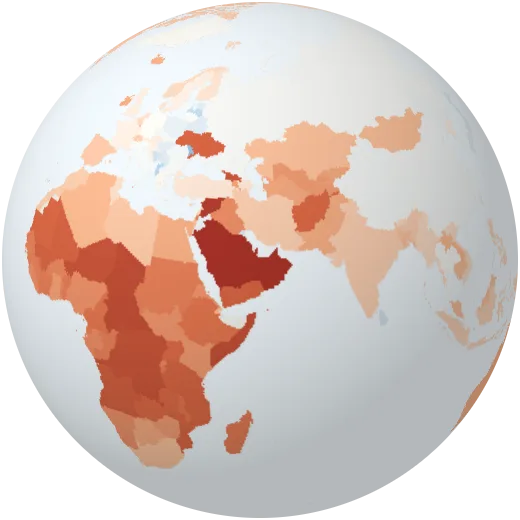
Population growth
How fast each population is growing or shrinking each year.
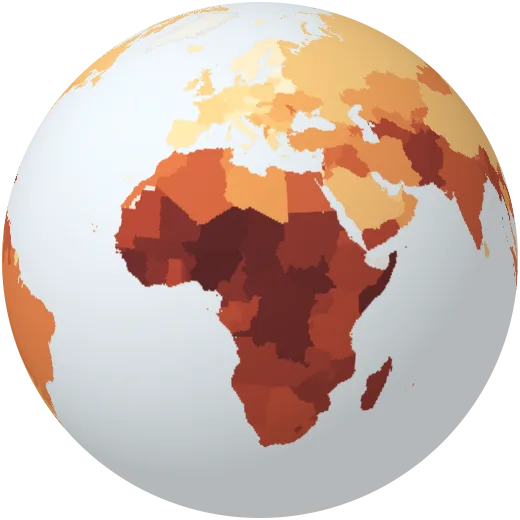
Child mortality
Children who die before their fifth birthday, per 1,000 born. The global rate has fallen by more than half since 1990.
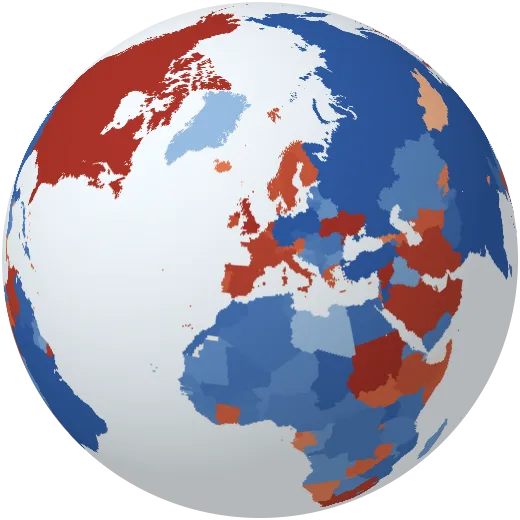
Migration
Net migration: people arriving minus people leaving each year.
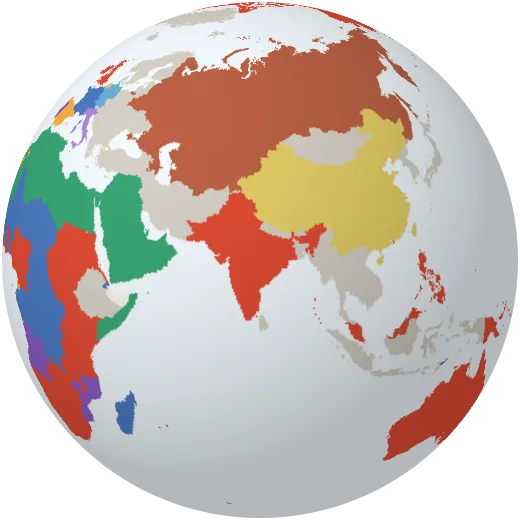
Languages
The most widely spoken official language of each country. English, French, Arabic and Spanish are each official in dozens of countries.
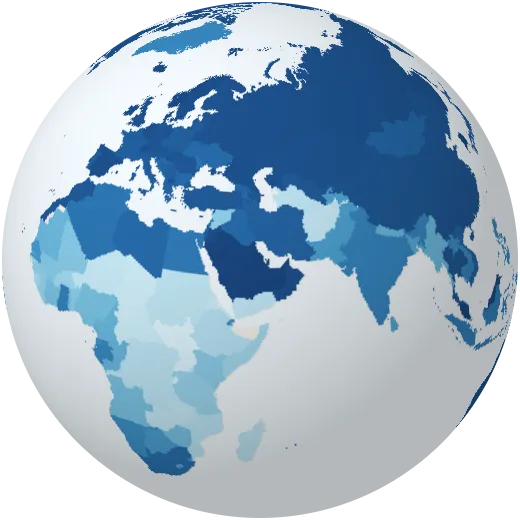
Internet use
Share of people who used the internet in the last three months. About two thirds of humanity is now online.
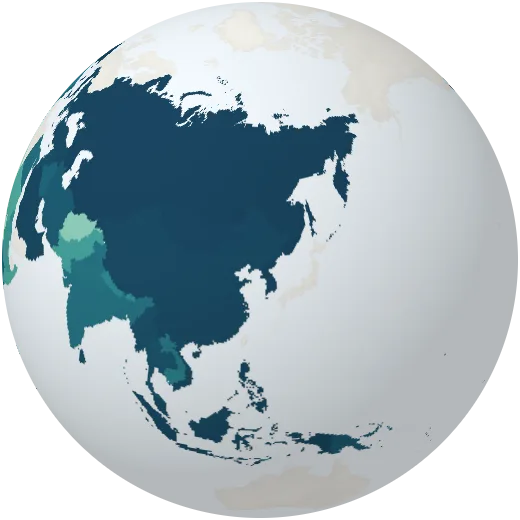
Literacy
Share of adults who can read and write.
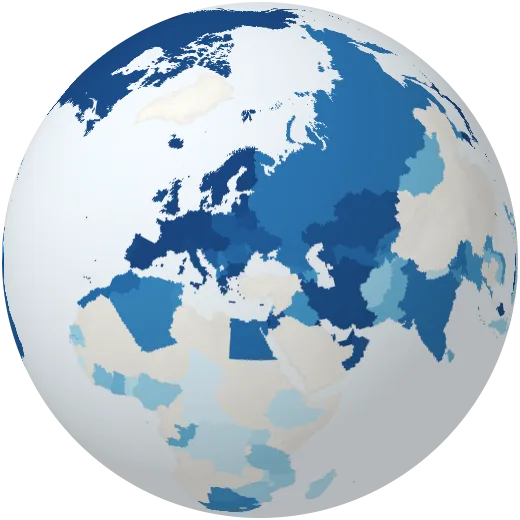
Safe drinking water
Share of people with safely managed drinking water at home.
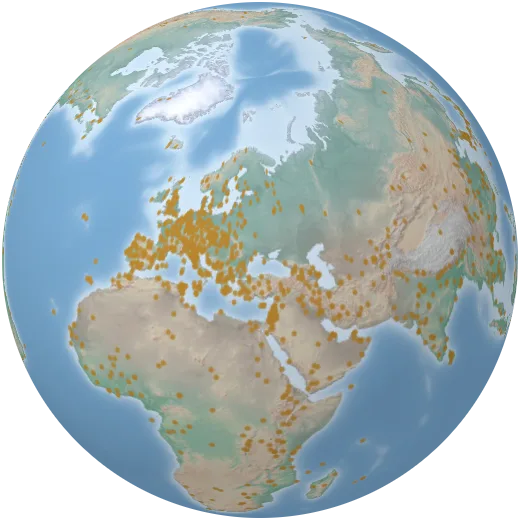
World Heritage sites
More than 1,200 places of outstanding value to humanity listed by UNESCO, from Machu Picchu to the Great Barrier Reef.
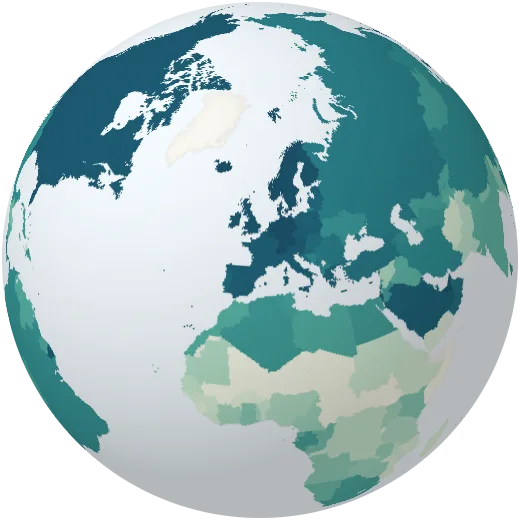
Human development
The Human Development Index combines health, education and income into one number between 0 and 1.
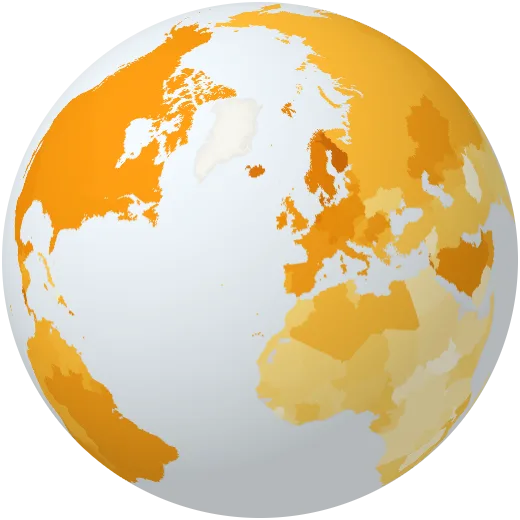
Life satisfaction
How people rate their own lives on a scale from 0 to 10, from the World Happiness Report.
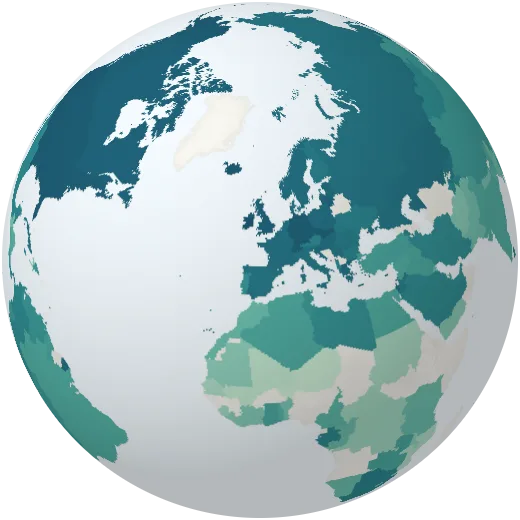
Years in school
Average years of schooling of people aged 15 to 64.
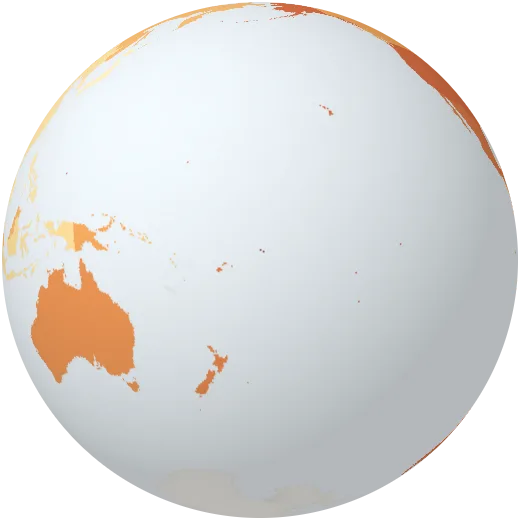
Obesity
Share of adults with obesity (a BMI of 30 or more).
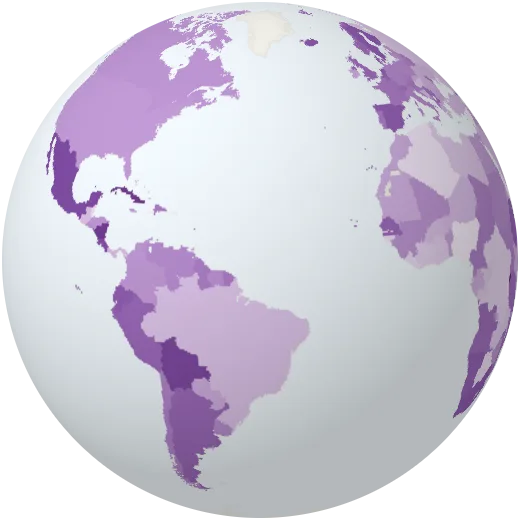
Women in parliament
Share of seats in national parliaments held by women.
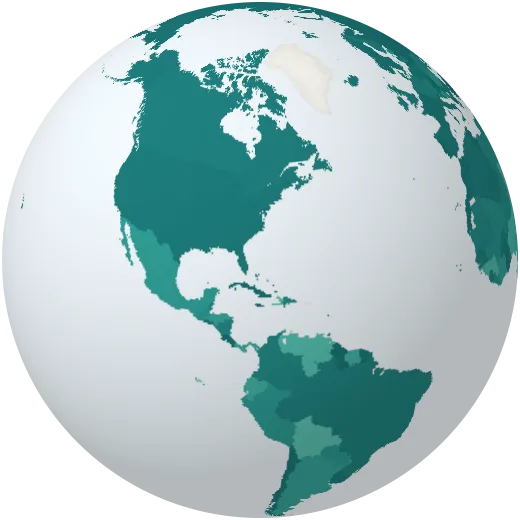
Vaccination
Share of one-year-olds vaccinated against diphtheria, tetanus and whooping cough (DTP3), a common measure of how well health systems reach children.
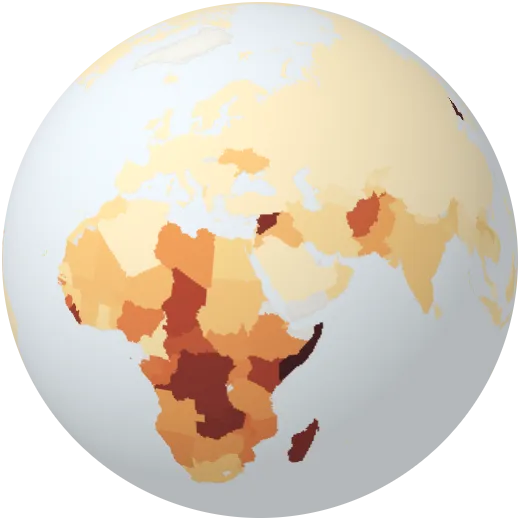
Hunger
Share of people who do not get enough food to meet their basic energy needs.
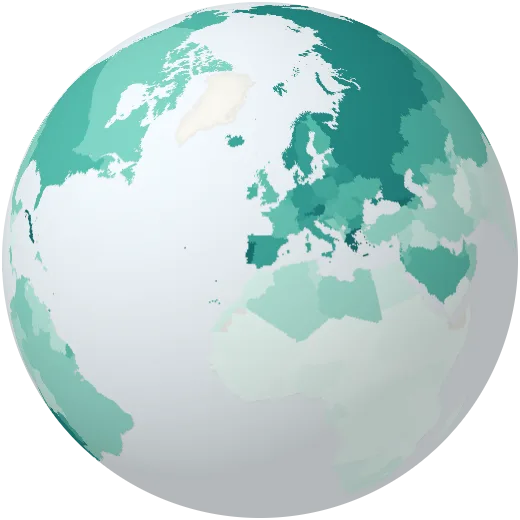
Doctors
Medical doctors per 1,000 people.
Mobile phones
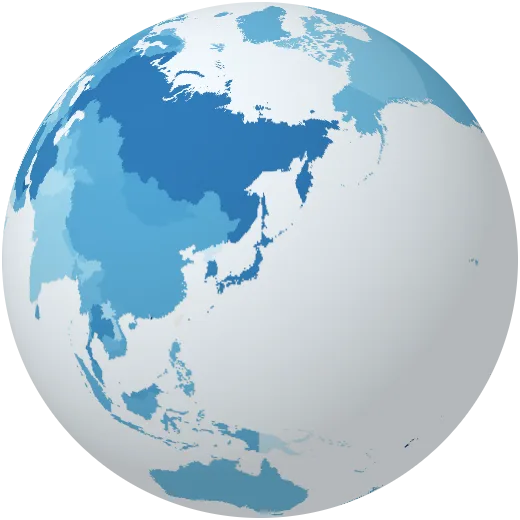
Mobile phone subscriptions per 100 people. Many countries have more subscriptions than people.
University
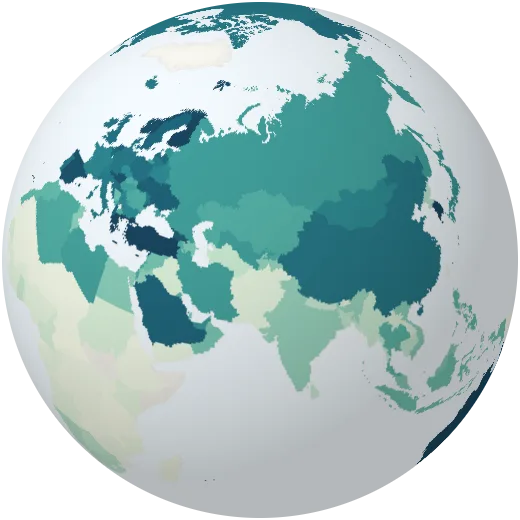
Students in higher education as a share of the age group that would normally be studying.
Population density
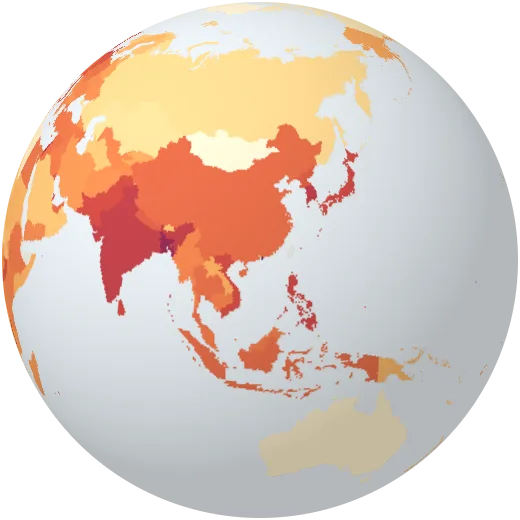
People per square kilometre of land. Bangladesh is more than a hundred times as crowded as Australia.
Birth rate
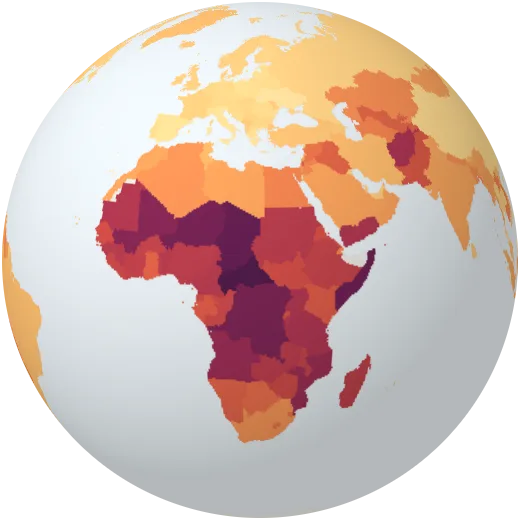
Babies born each year per 1,000 people. It has halved worldwide since 1960.
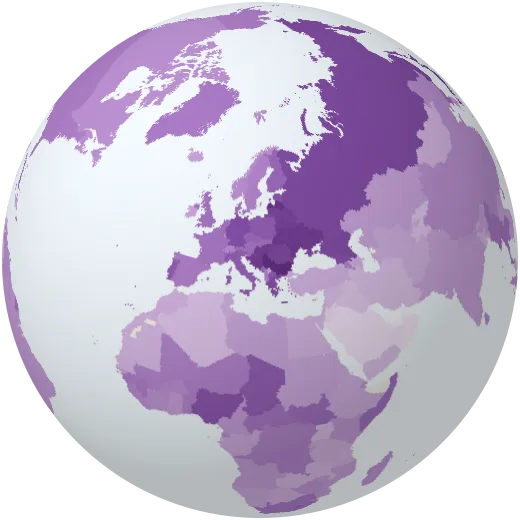
Death rate
Deaths each year per 1,000 people. Ageing countries have higher rates even when health care is good.
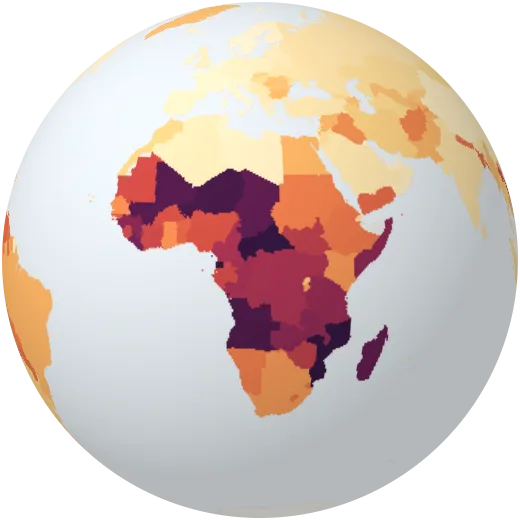
Teenage births
Births to girls aged 15 to 19, per 1,000 girls of that age.
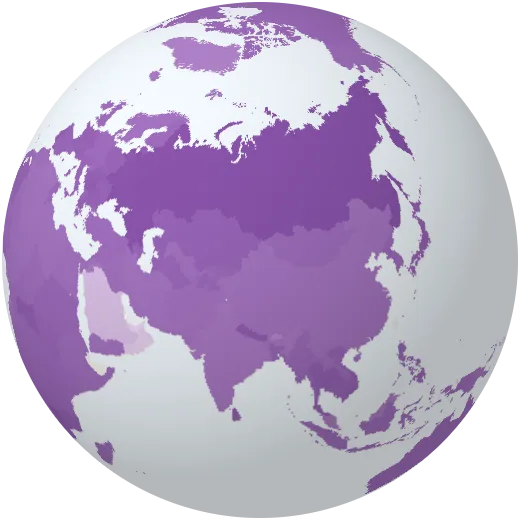
Women in the population
Share of the population that is female. Gulf states with many male migrant workers stand out.
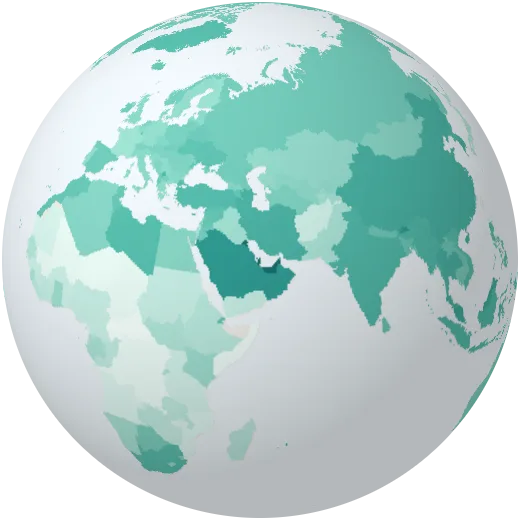
Working-age population
Share of people aged 15 to 64.
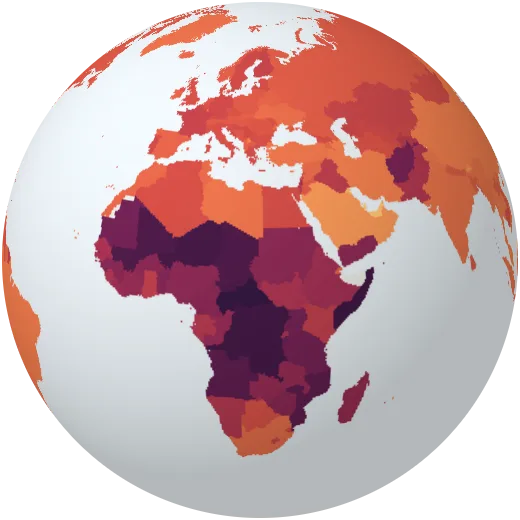
Dependency ratio
Children and older people for every 100 people of working age.
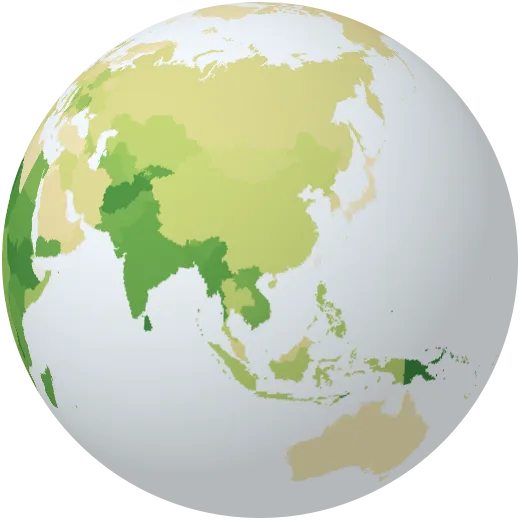
Rural population
Share of people living in the countryside rather than in towns and cities.
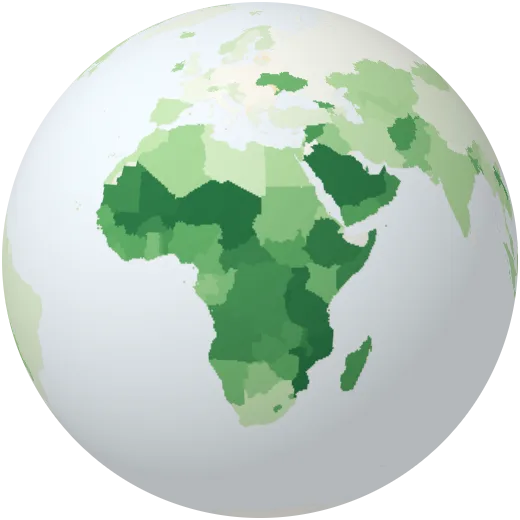
Urban growth
How fast the number of city dwellers grows each year.
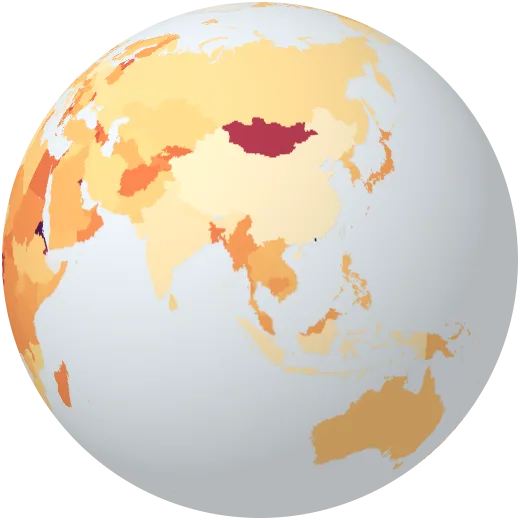
Life in the largest city
Share of a country’s city dwellers who live in its single largest city.
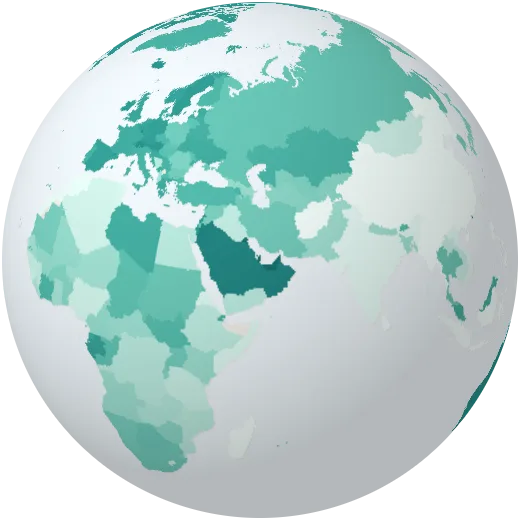
Migrants
Share of residents born in another country.
Health
How long and how well people live: care, disease, food and clean water.
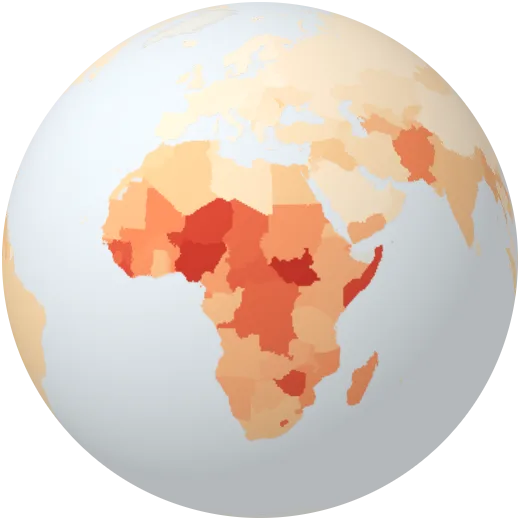
Infant mortality
Babies who die before their first birthday, per 1,000 born alive.
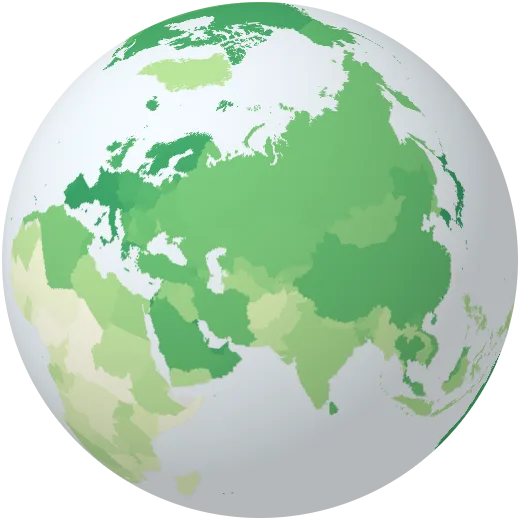
Life expectancy of women
How long a girl born today can expect to live.
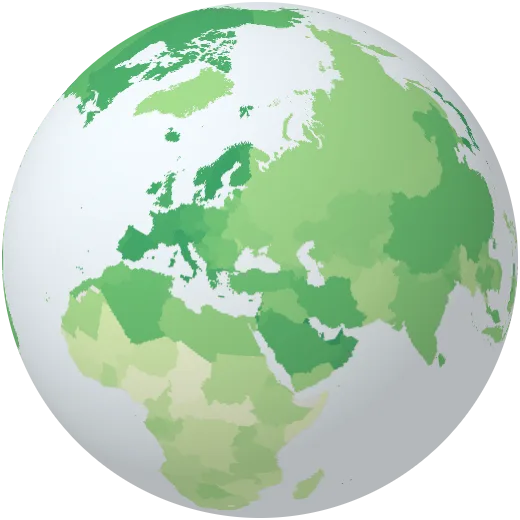
Life expectancy of men
How long a boy born today can expect to live. Men live shorter almost everywhere.
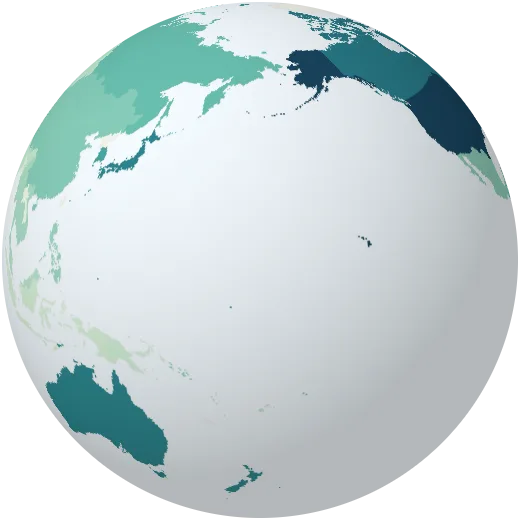
Health spending
Spending on health care as a share of the economy.
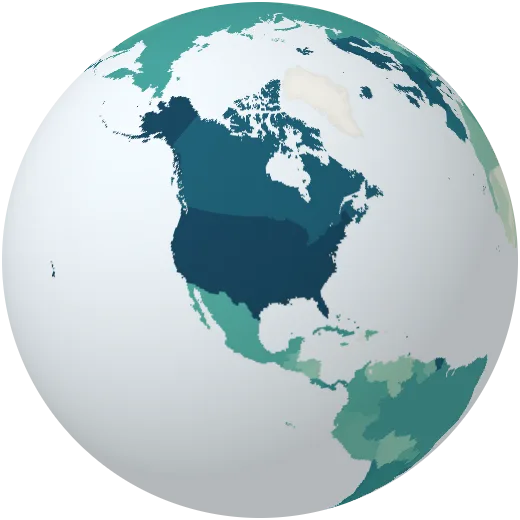
Health spending per person
Health spending per person in dollars, from under $50 to over $10,000.
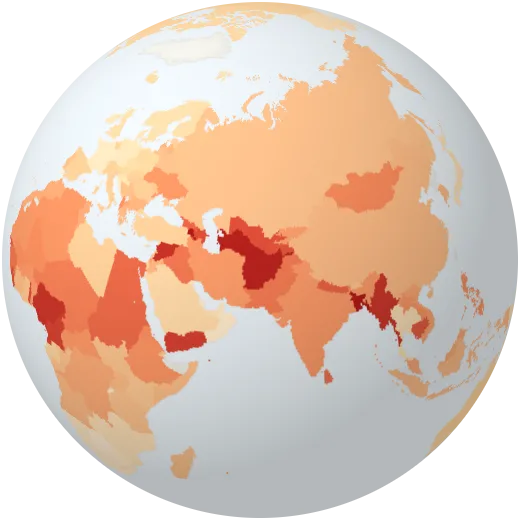
Paying for care yourself
Share of health spending that people pay directly from their own pocket.
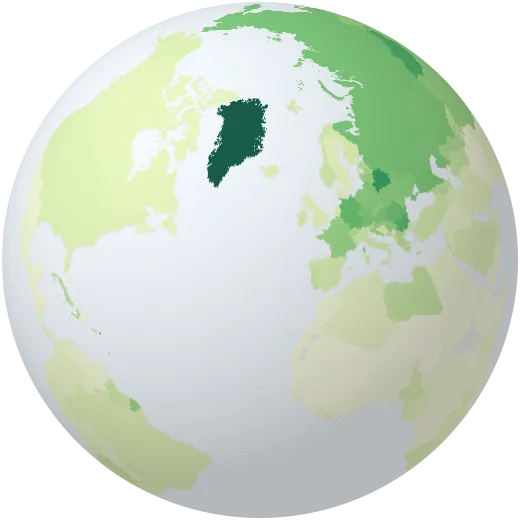
Hospital beds
Hospital beds per 1,000 people.
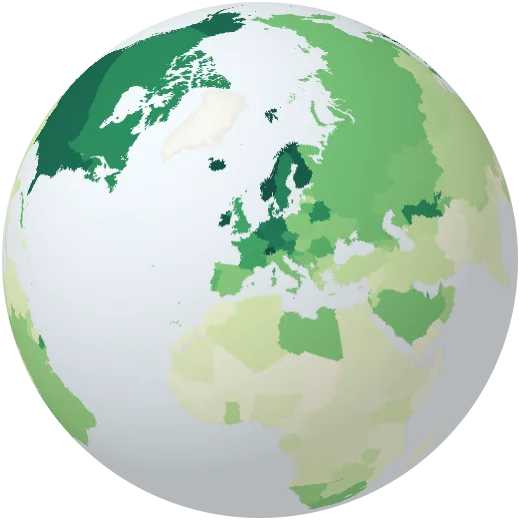
Nurses and midwives
Nurses and midwives per 1,000 people.
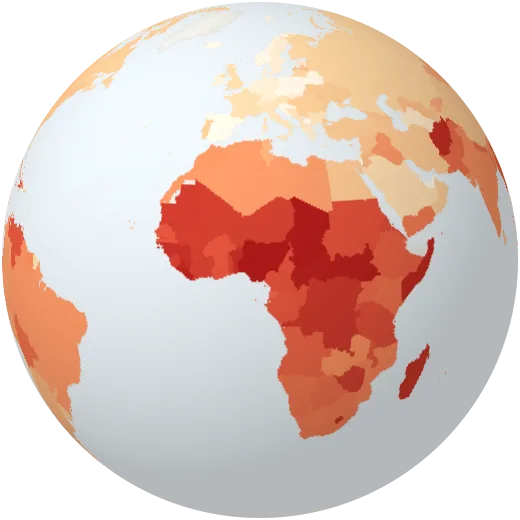
Maternal mortality
Women who die from pregnancy or childbirth per 100,000 live births.
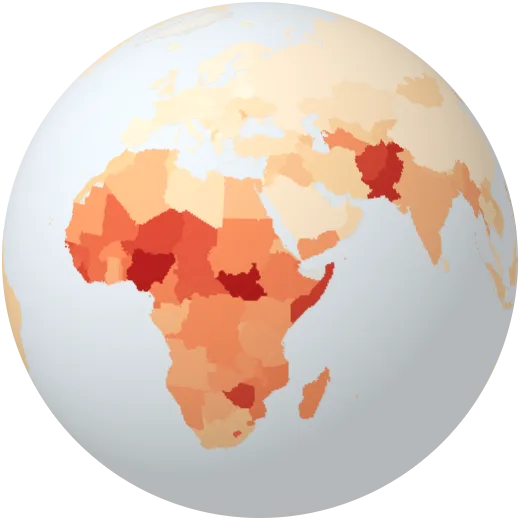
Newborn deaths
Babies who die in their first four weeks, per 1,000 born alive.
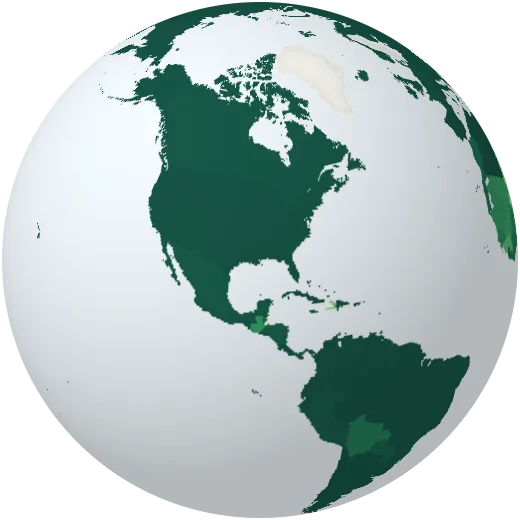
Births with a midwife or doctor
Share of births attended by a doctor, nurse or midwife.
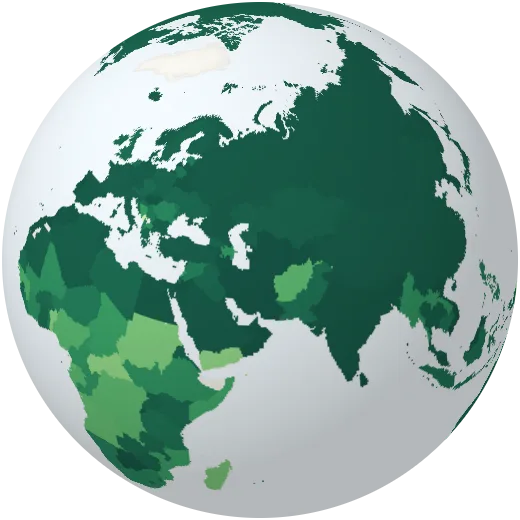
Measles vaccination
Share of one-year-olds vaccinated against measles.
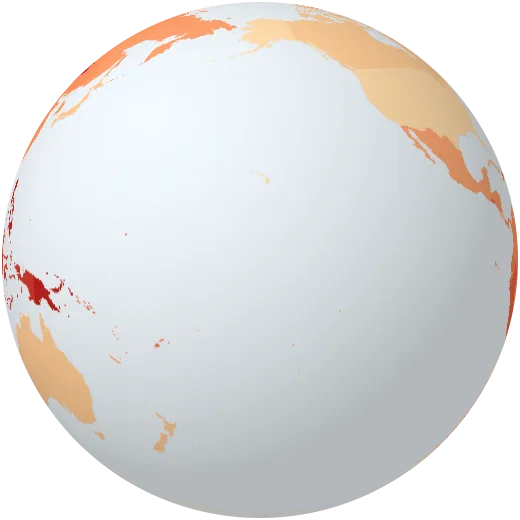
Tuberculosis
New tuberculosis cases each year per 100,000 people.
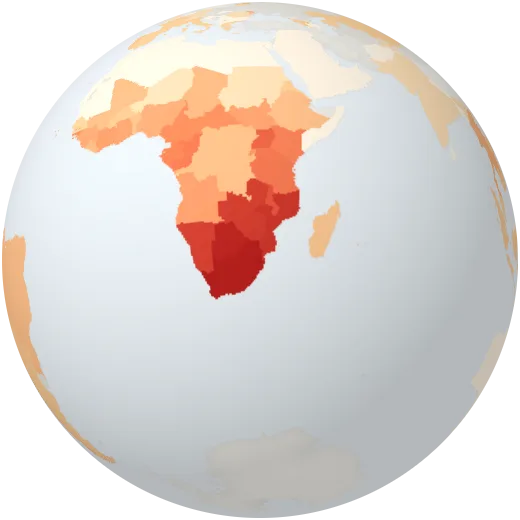
HIV
Share of adults aged 15 to 49 living with HIV.
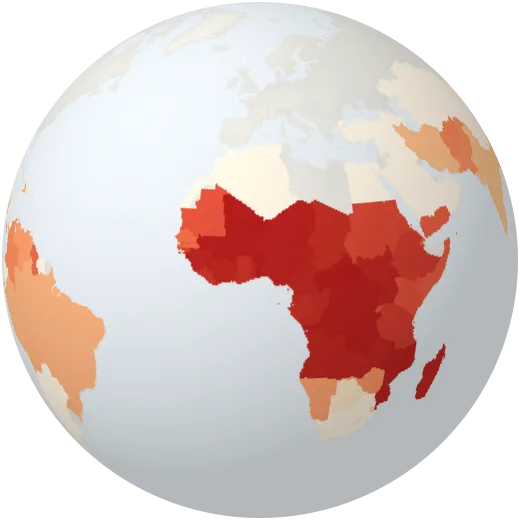
Malaria
New malaria cases per 1,000 people at risk. Almost all are in Africa.
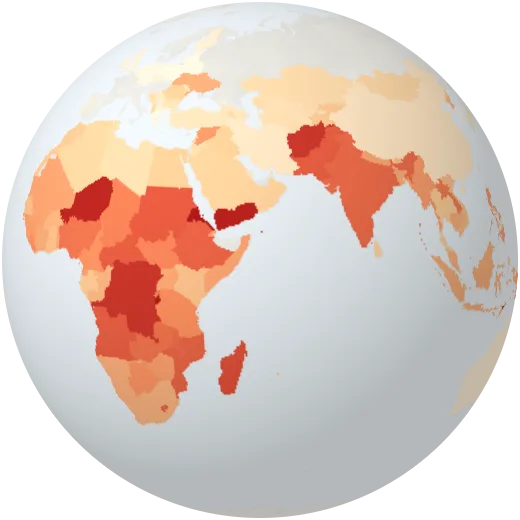
Stunted children
Share of young children too short for their age, a sign of long-term undernutrition.
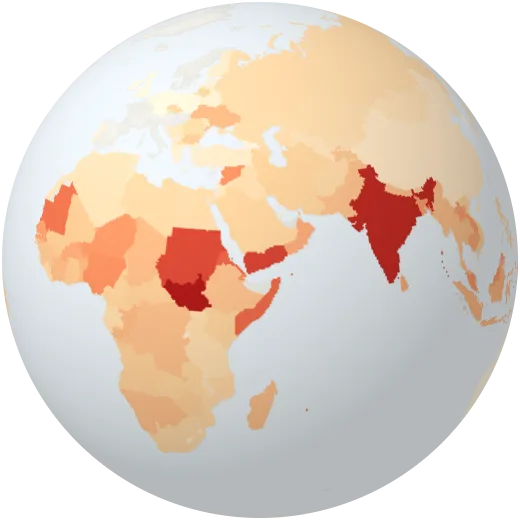
Wasted children
Share of young children too thin for their height, a sign of acute hunger.
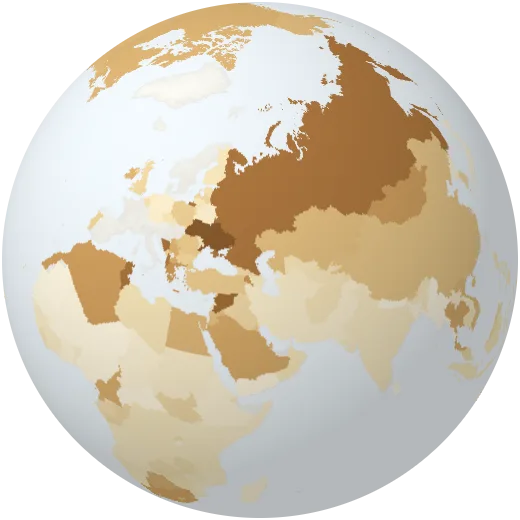
Overweight children
Share of young children who are overweight.
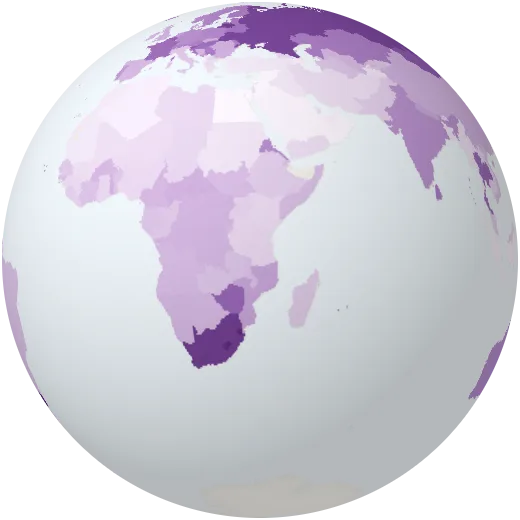
Suicide
Deaths by suicide per 100,000 people. Help is available: in most countries there is a free helpline.
Smoking
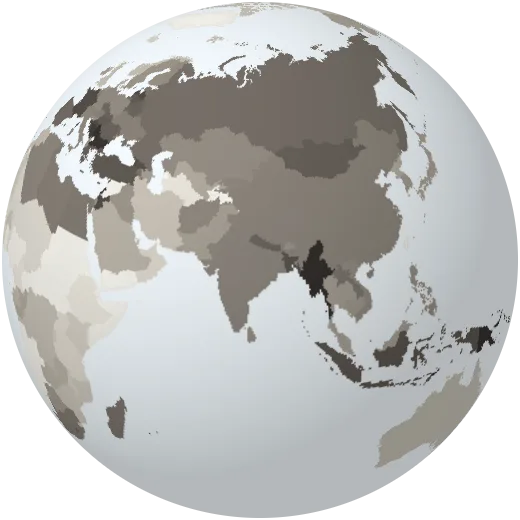
Share of adults who smoke tobacco.
Alcohol
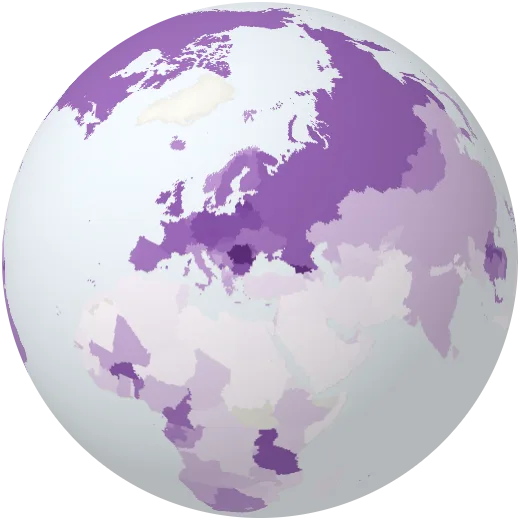
Pure alcohol drunk per adult each year.
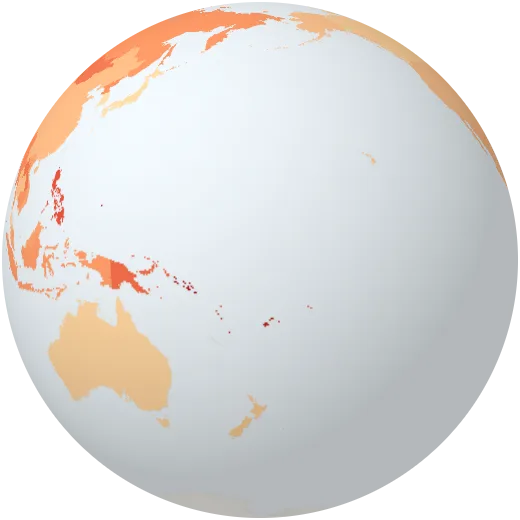
Dying early of heart disease, cancer or diabetes
Chance that a 30-year-old dies before 70 from heart disease, cancer, diabetes or lung disease.
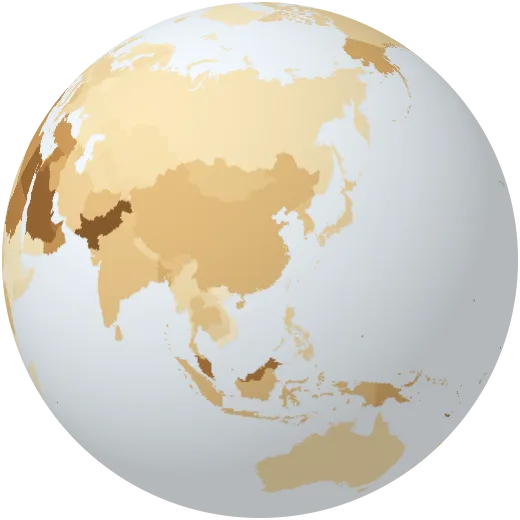
Diabetes
Share of adults aged 20 to 79 with diabetes.
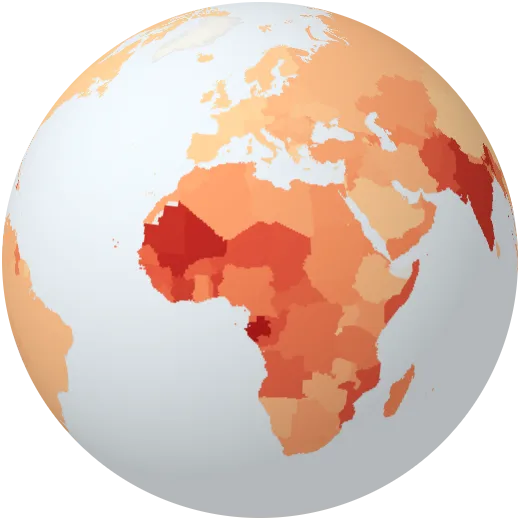
Anaemia in women
Share of women aged 15 to 49 with anaemia, often from too little iron in the diet.
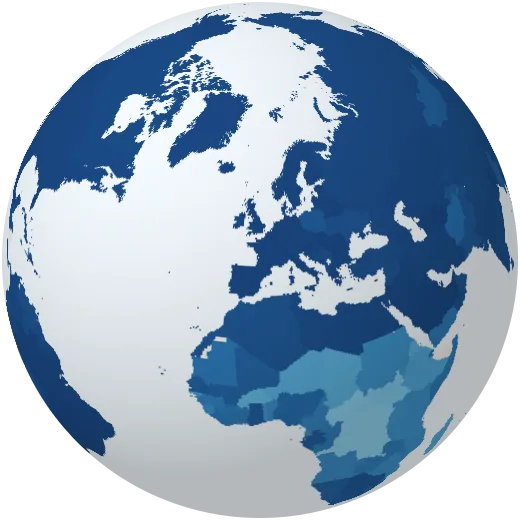
Basic drinking water
Share of people with clean water within a 30-minute round trip.
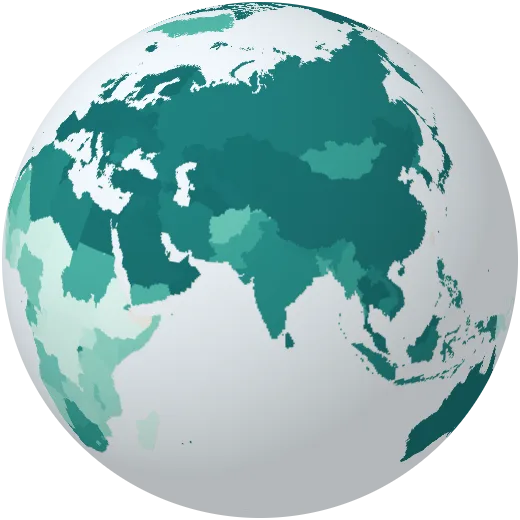
Basic toilets
Share of people with at least a basic toilet that is not shared.
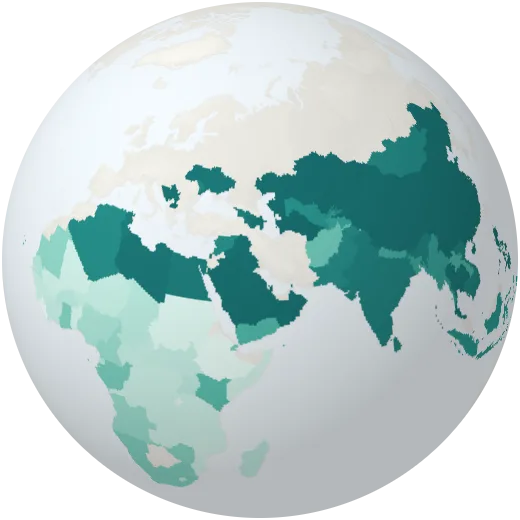
Soap and water at home
Share of people with a place to wash hands with soap and water at home.
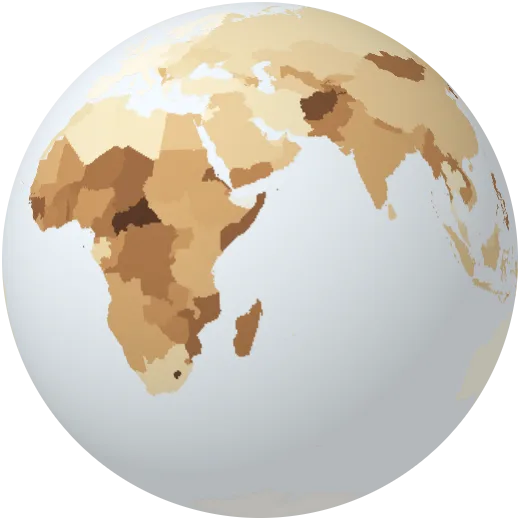
Deaths from air pollution
Deaths from polluted air indoors and outdoors per 100,000 people.
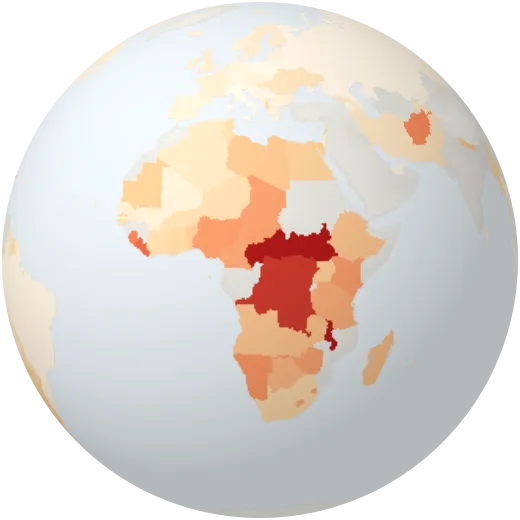
Severe food insecurity
Share of people who at times ran out of food and went a day or more without eating.
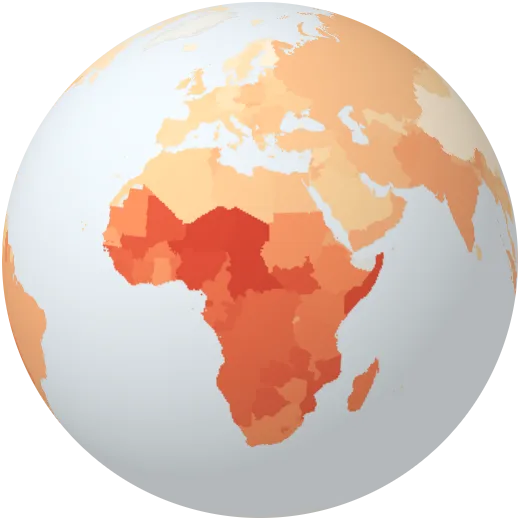
Deaths from infections, birth and hunger
Share of deaths from infectious diseases, pregnancy, birth and malnutrition.
Society
School, work, science, safety and how countries are connected.
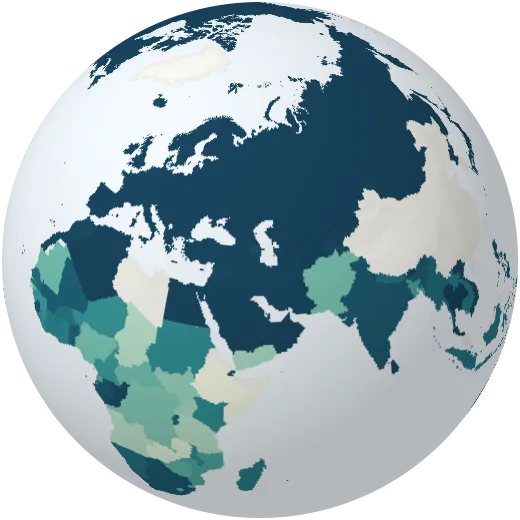
Birth registration
Share of young children whose birth is officially registered.
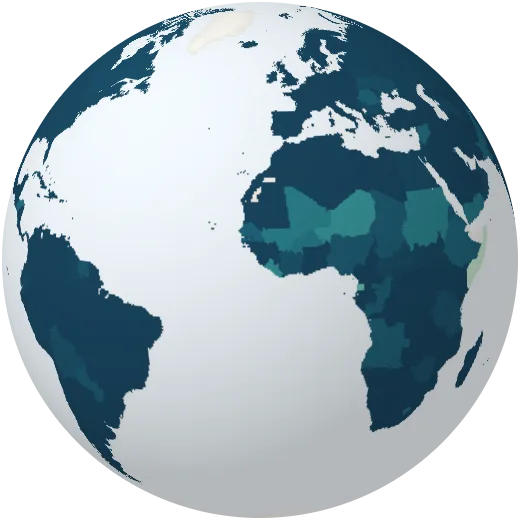
Primary school enrolment
Children in primary school compared with the number of children of that age. Above 100% means older pupils are still in class.
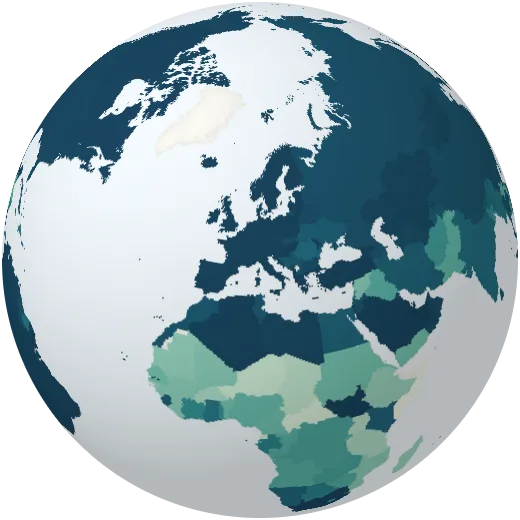
Secondary school enrolment
Young people in secondary school compared with the number of that age.
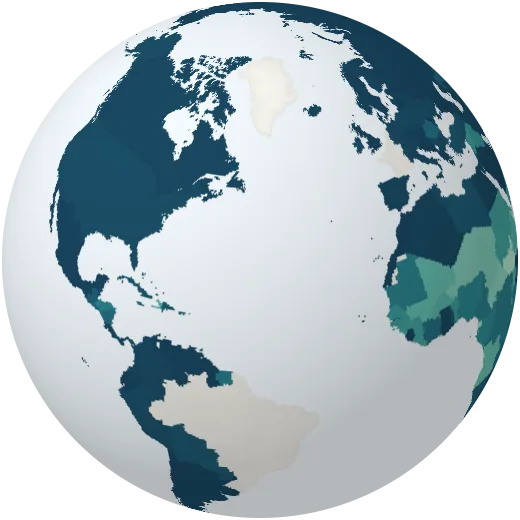
Finishing primary school
Share of children who finish the last year of primary school.
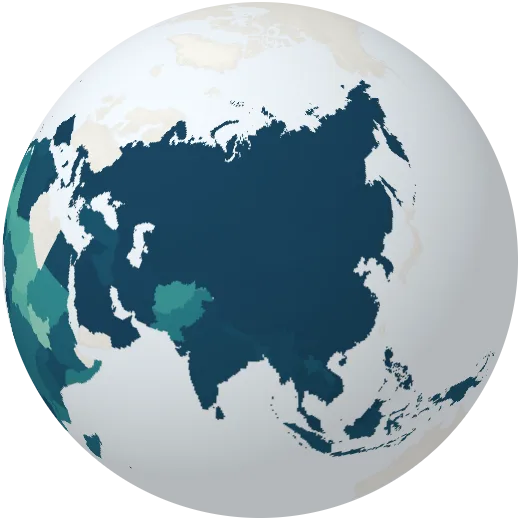
Youth literacy
Share of young people aged 15 to 24 who can read and write.
Pupils per teacher
Primary school pupils for every teacher.
Education spending
Government spending on education as a share of the economy.
People in work or seeking it
Share of people aged 15 and over who work or are looking for work.
Women at work
Share of women aged 15 and over who work or are looking for work.
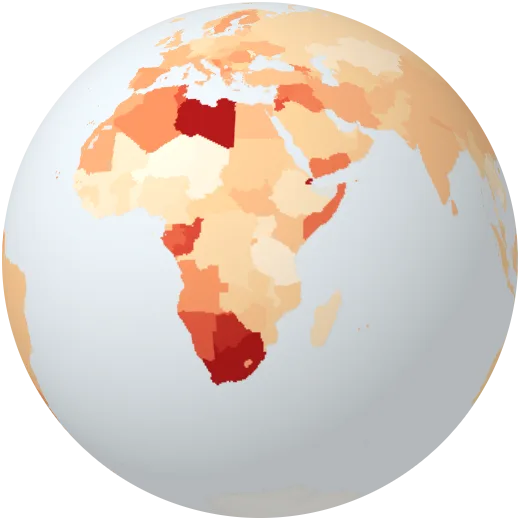
Youth unemployment
Share of young people aged 15 to 24 who want to work but have no job.
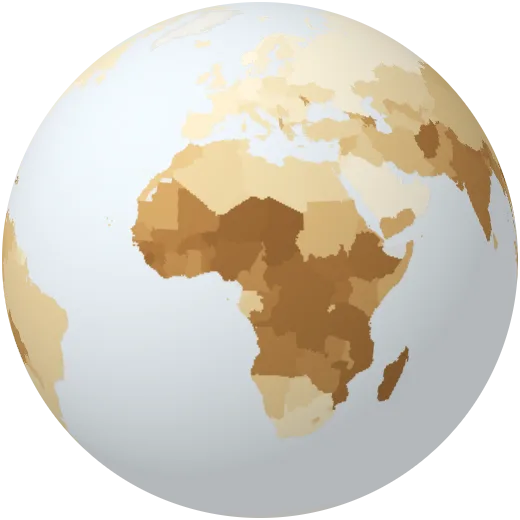
Self-employed
Share of workers who work for themselves, from farmers to shopkeepers.
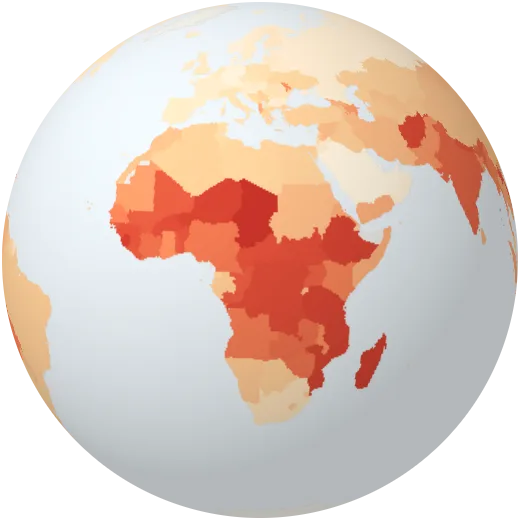
Insecure work
Workers on their own account or helping in a family business, usually without a contract or protection.
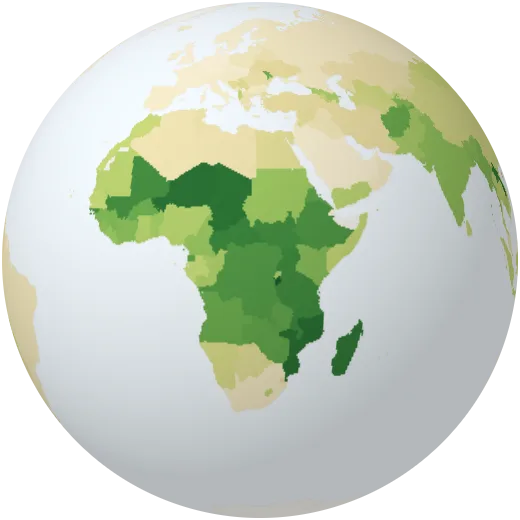
Jobs in farming
Share of workers employed in farming, forestry and fishing.
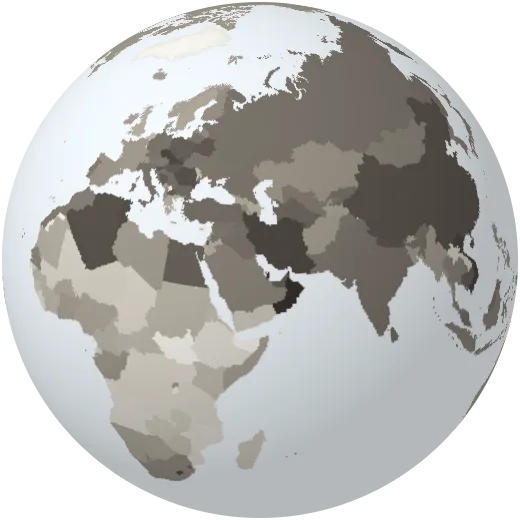
Jobs in industry
Share of workers in factories, mining, construction and utilities.
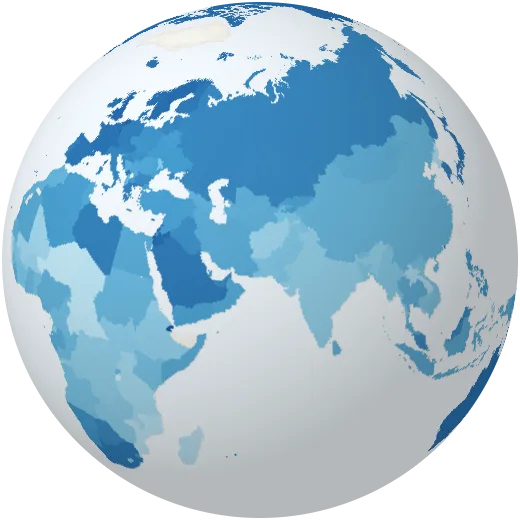
Jobs in services
Share of workers in services: shops, offices, transport, care and teaching.
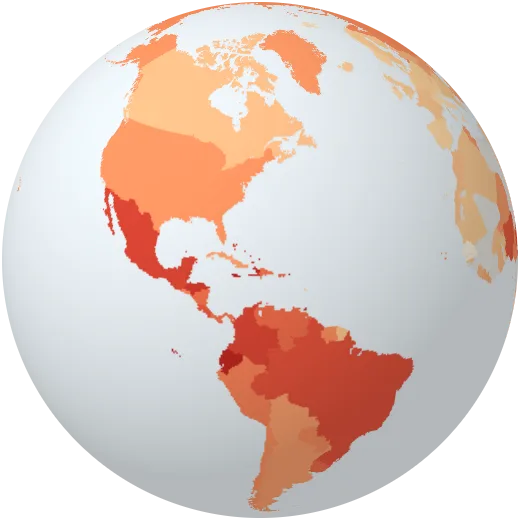
Homicides
Intentional killings per 100,000 people.
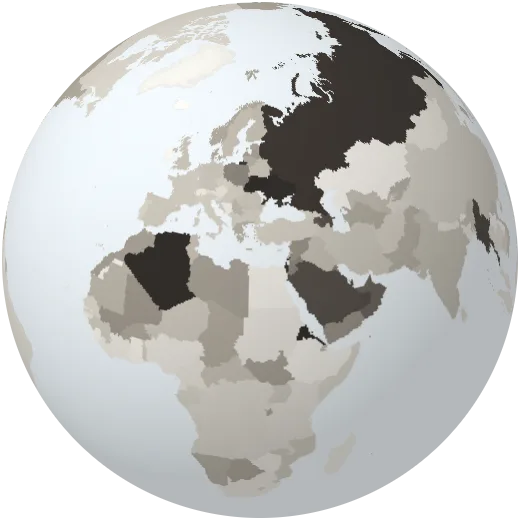
Military spending
Military spending as a share of the economy.
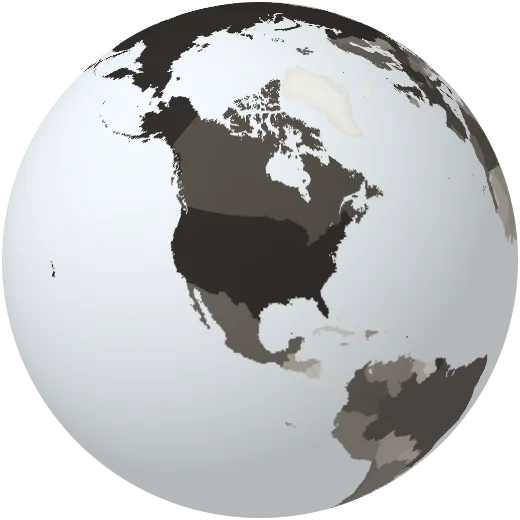
Military budget
Military spending in dollars. The United States spends more than the next nine countries together.
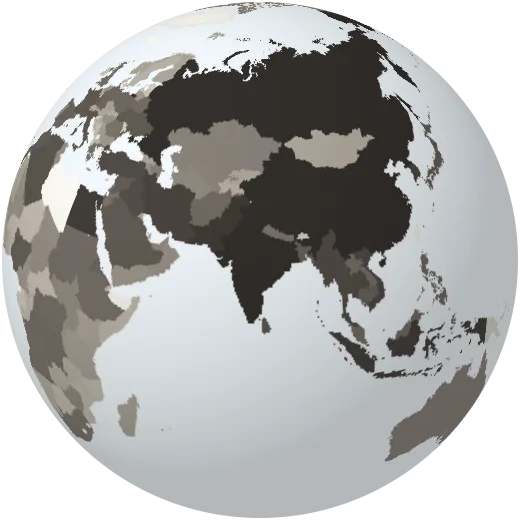
Armed forces
Active military personnel.
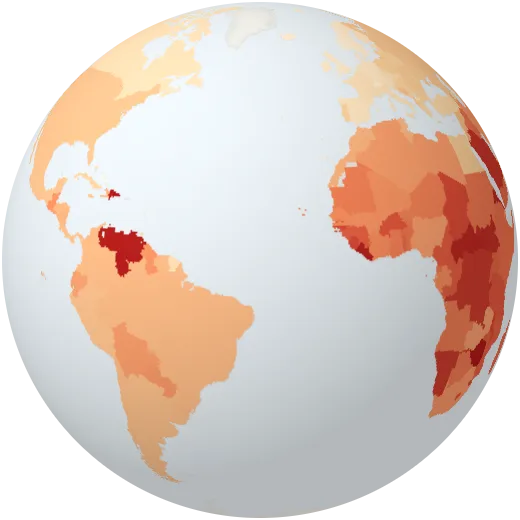
Road deaths
People killed in road traffic each year per 100,000 people.
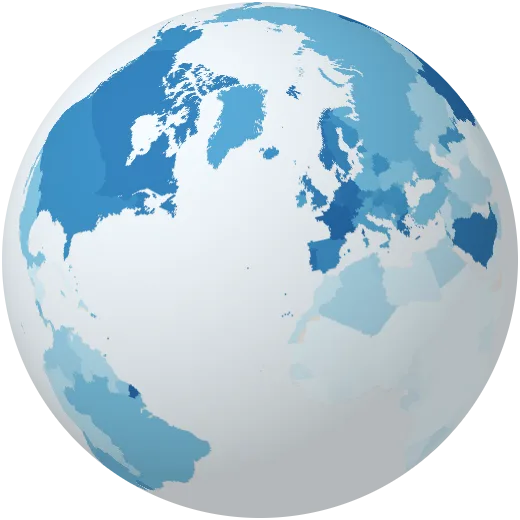
Fixed broadband
Fixed internet subscriptions per 100 people.
Secure web servers
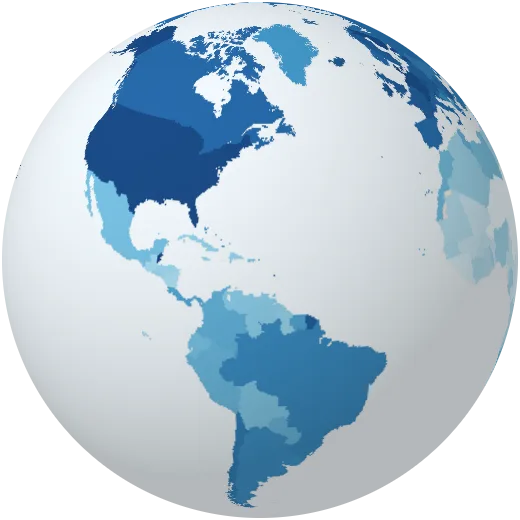
Secure internet servers per million people, a rough measure of how much of the web lives in a country.
Air passengers
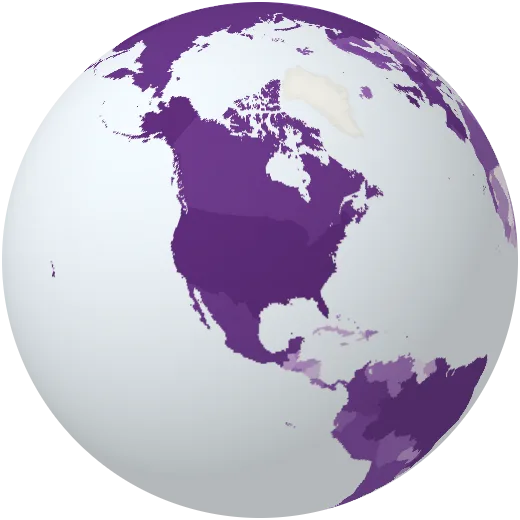
Passengers carried by airlines registered in each country.
Researchers
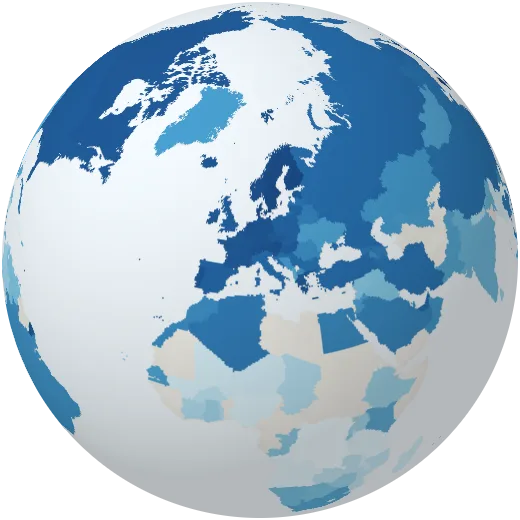
Researchers in science and development per million people.
Research spending
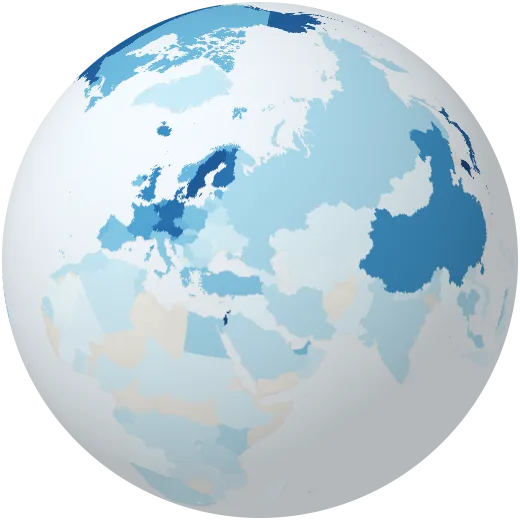
Spending on research and development as a share of the economy.
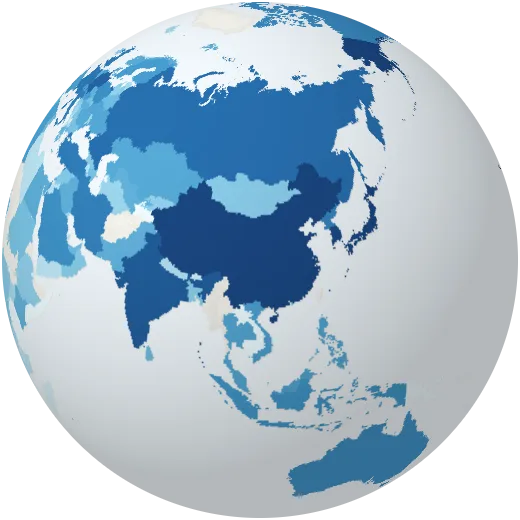
Patents
Patent applications filed by residents each year.
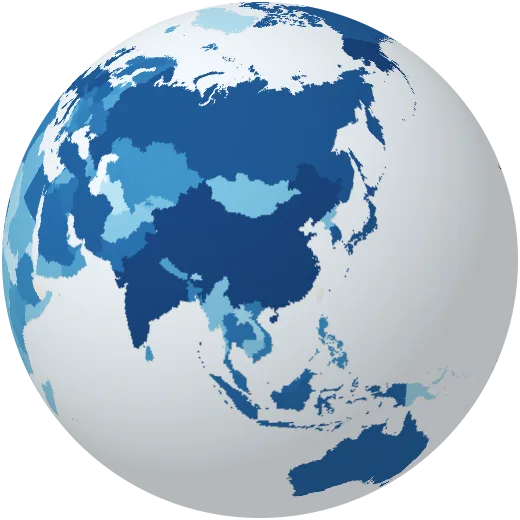
Scientific articles
Scientific and technical articles published each year.
Economy
Income, trade, farming, food and the minerals we mine.
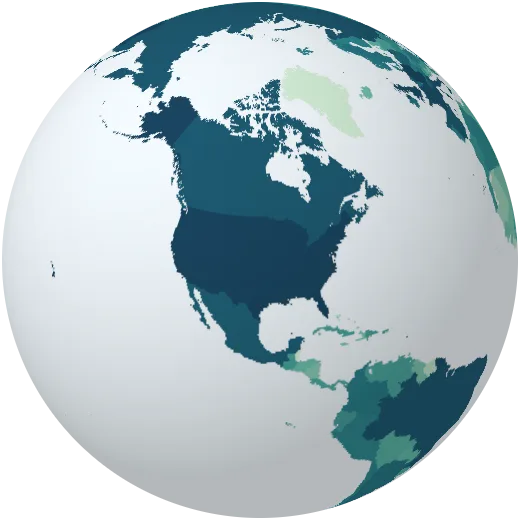
Economy size
Gross domestic product: the value of everything a country produces in a year, in current US dollars.
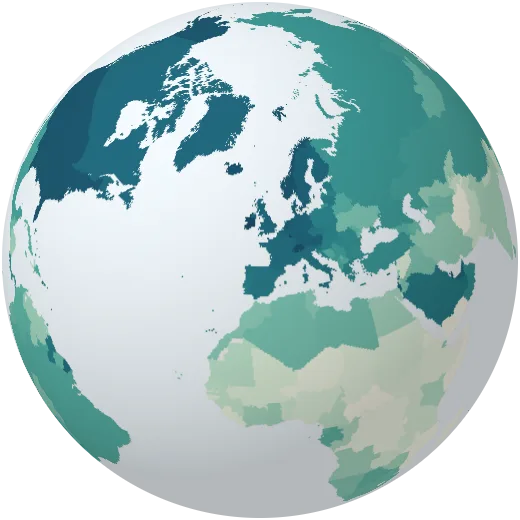
Income per person
GDP divided by population. It ranges from a few hundred dollars to more than 100,000 a year.
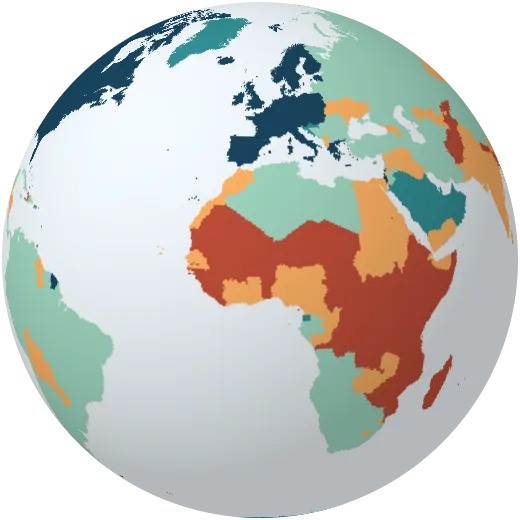
Income groups
Countries grouped by income per person, following the World Bank classification.
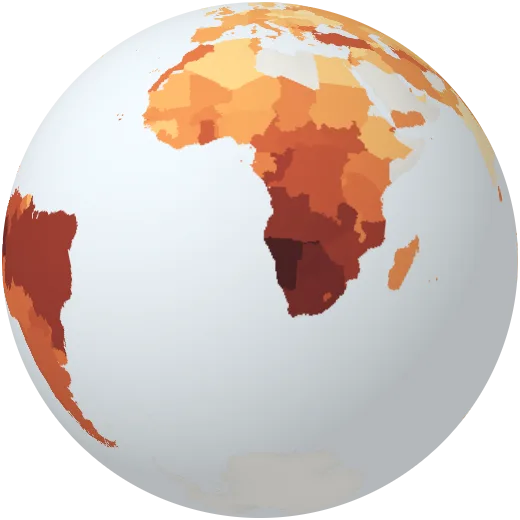
Inequality
The Gini index of income inequality: 0 means everyone has the same income, 100 means one person has everything.
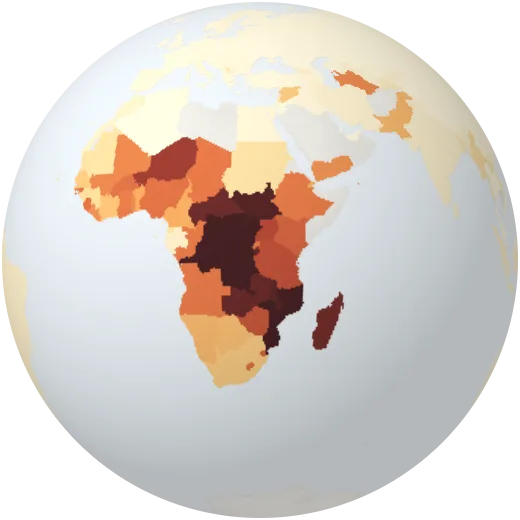
Extreme poverty
Share of people living on less than $3.00 a day (2021 prices), the international extreme poverty line.
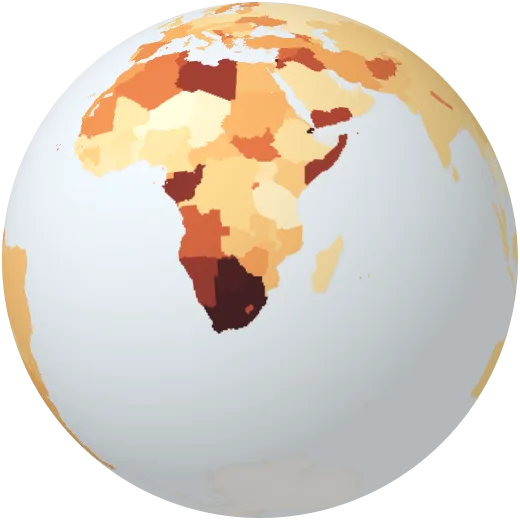
Unemployment
Share of people who want to work but have no job.
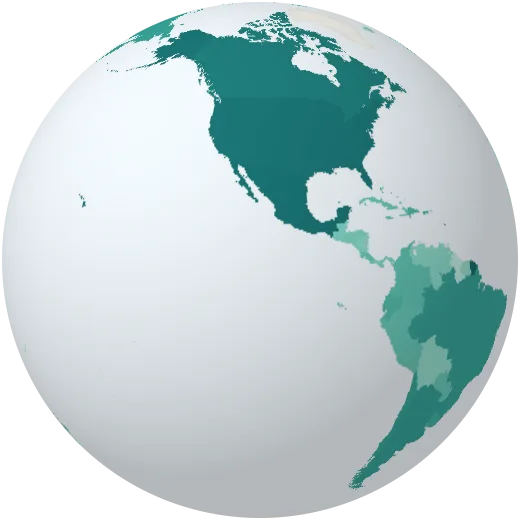
Tourism
International tourist arrivals per year, before the pandemic. France, Spain and the United States receive the most visitors.
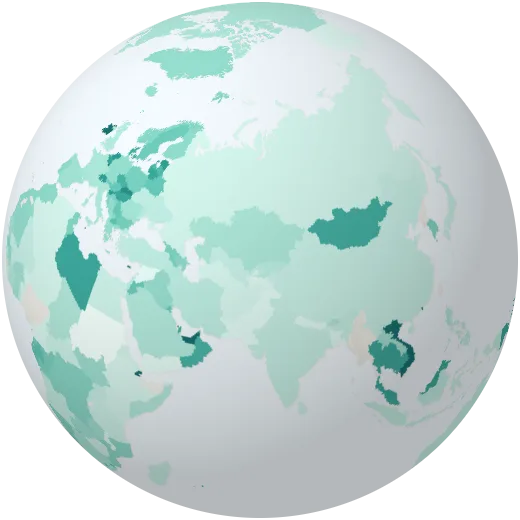
Trade
Exports of goods and services as a share of the economy.
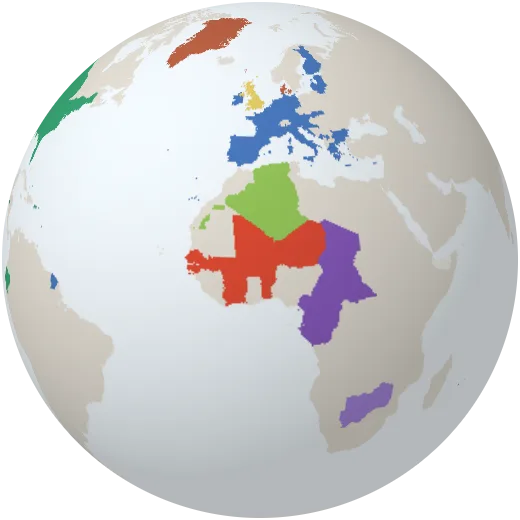
Currencies
Money used in each country. The euro, the US dollar and the two CFA francs are shared by many countries.
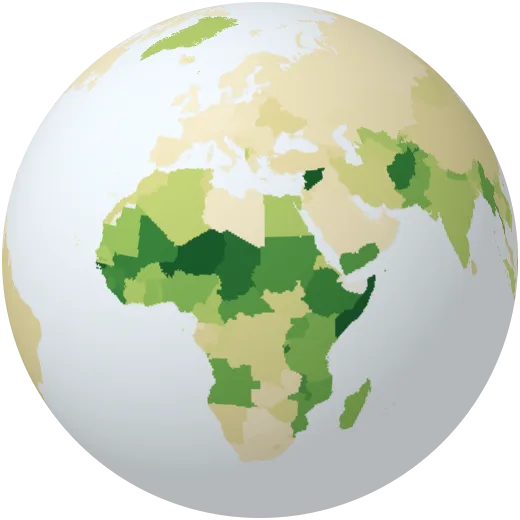
Farming in the economy
Agriculture, forestry and fishing as a share of the economy.
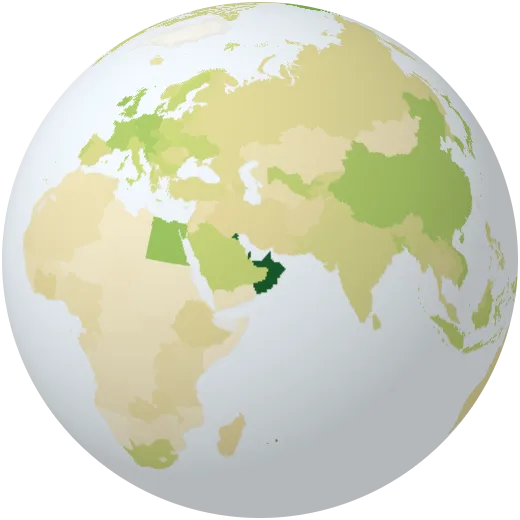
Crop yields
Cereal harvest per hectare. Fertiliser, irrigation and better seeds have tripled yields in many countries since 1960.
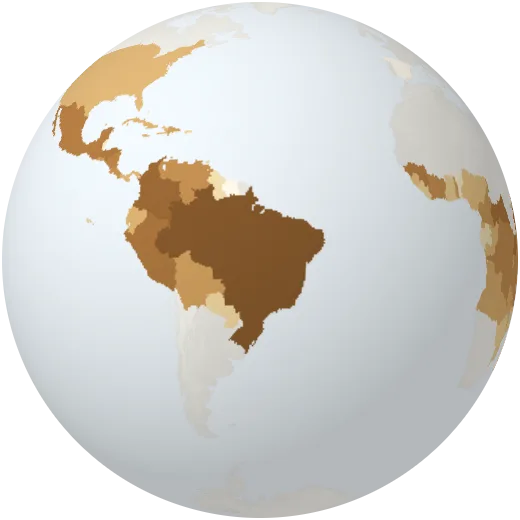
Coffee
Green coffee beans harvested each year. Brazil grows about a third of the world’s coffee, followed by Vietnam and Indonesia.
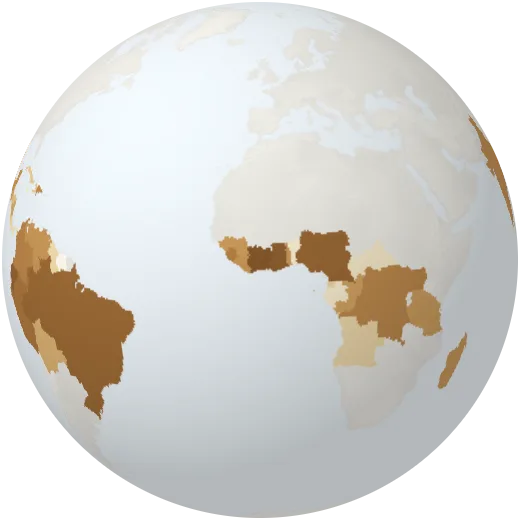
Cocoa
Cocoa beans harvested each year. Côte d’Ivoire and Ghana together grow about half of the world’s cocoa.
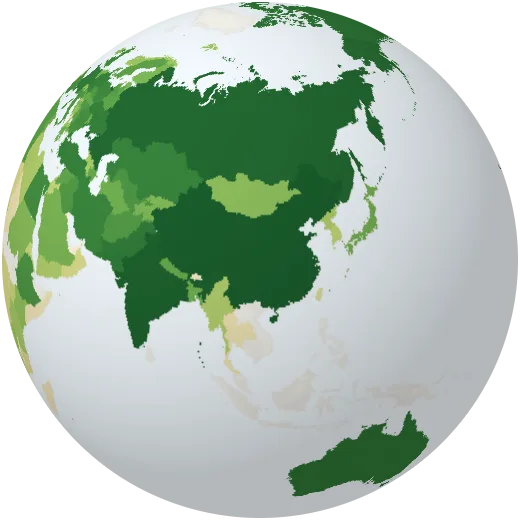
Wheat
Wheat harvested each year. China, India and Russia are the largest growers.
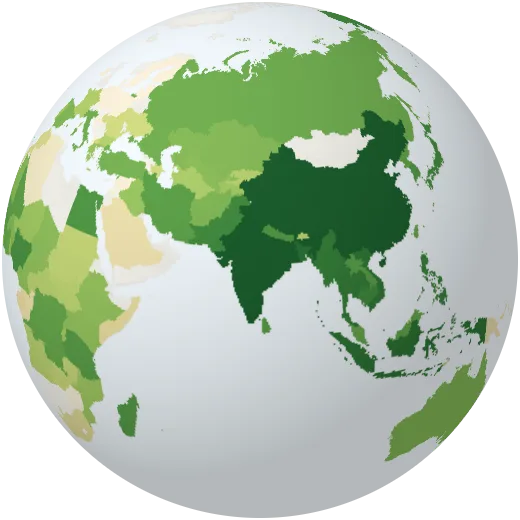
Rice
Rice harvested each year. Nine of every ten tonnes are grown in Asia.
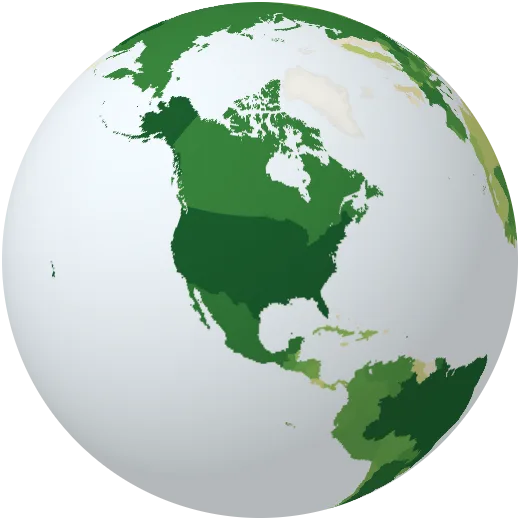
Maize
Maize (corn) harvested each year, the most produced grain on Earth. The United States and China grow more than half of it.
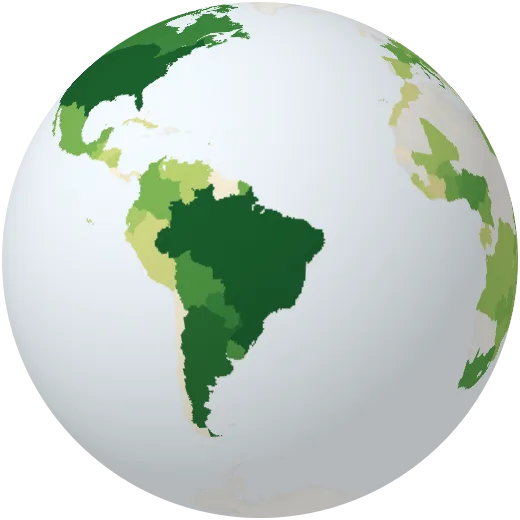
Soybeans
Soybeans harvested each year, mostly for animal feed. Brazil and the United States grow two thirds; expansion in South America drives deforestation.
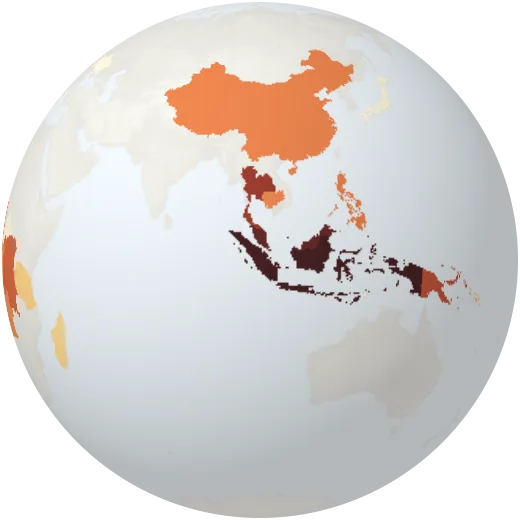
Palm oil
Palm oil produced each year. Indonesia and Malaysia make more than 80%; plantations have replaced large areas of rainforest.
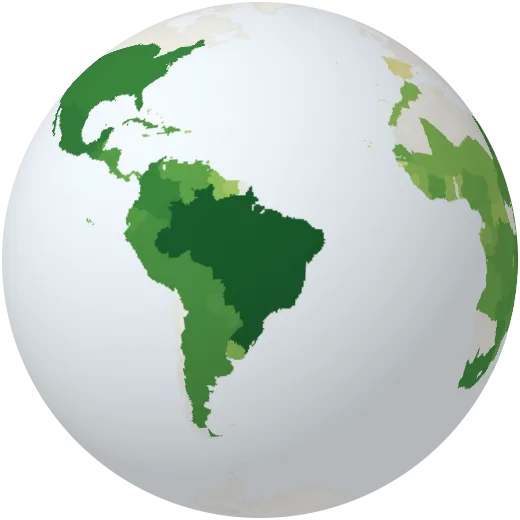
Sugar cane
Sugar cane harvested each year, used for sugar and ethanol. Brazil and India grow more than half.
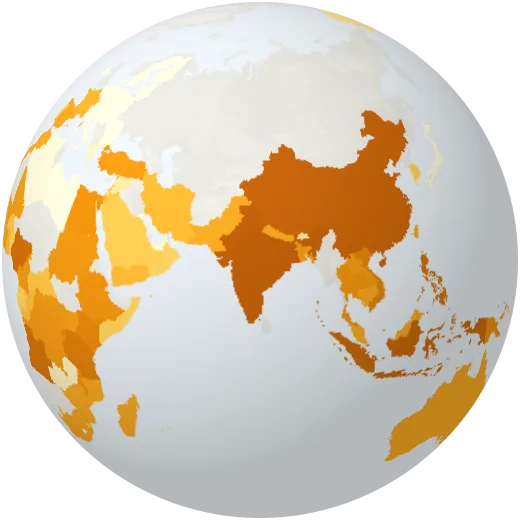
Bananas
Bananas harvested each year. India is the largest grower; Ecuador and the Philippines export the most.
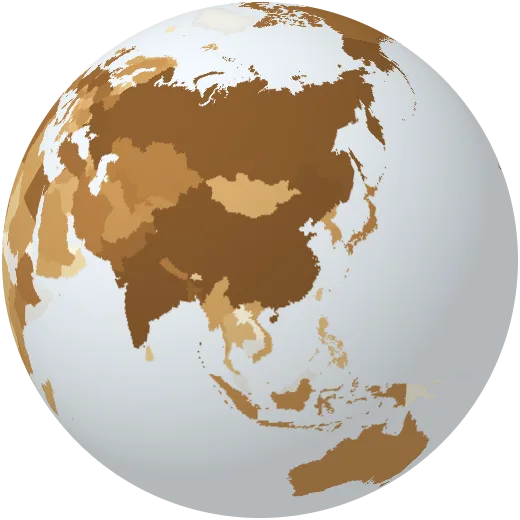
Potatoes
Potatoes harvested each year. China and India grow the most.
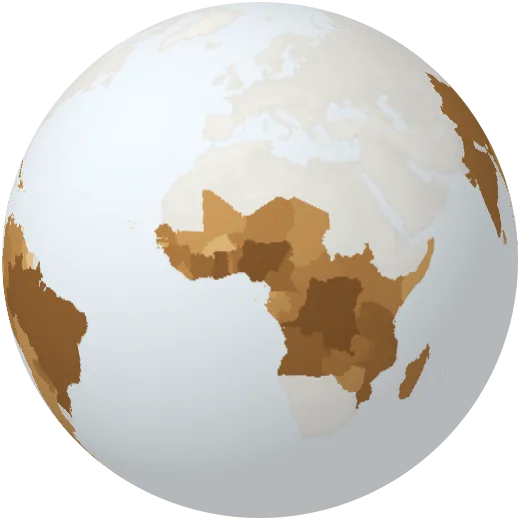
Cassava
Cassava harvested each year, a staple food for about 800 million people. Nigeria grows the most.
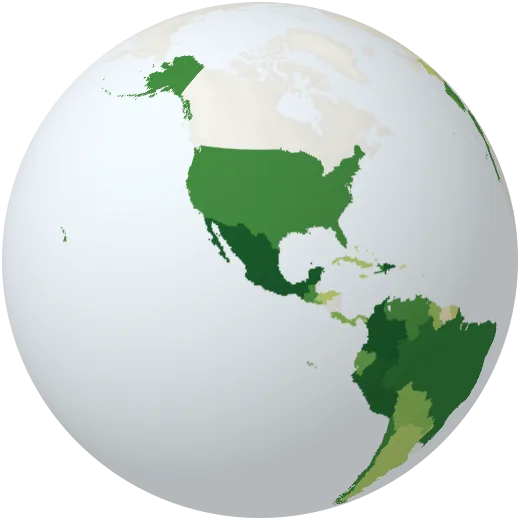
Avocados
Avocados harvested each year. Mexico grows nearly a third of the world’s avocados.
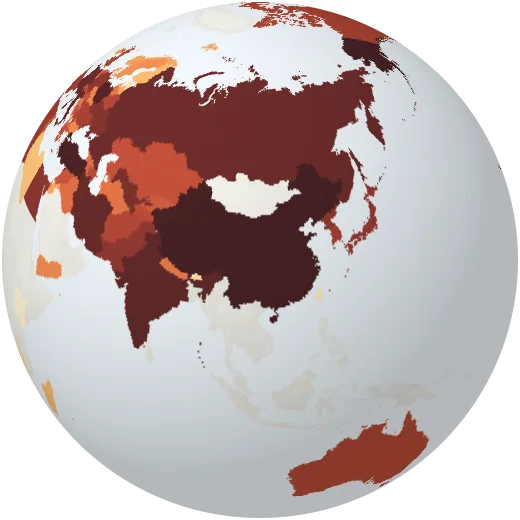
Apples
Apples harvested each year. China grows about half of them.
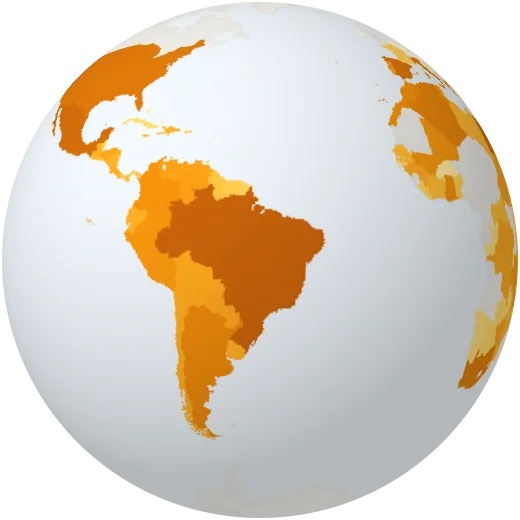
Oranges
Oranges harvested each year. Brazil grows the most, much of it for juice.
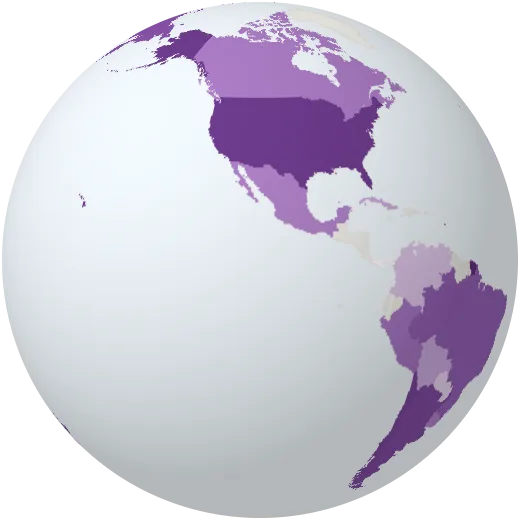
Wine
Wine produced each year. Italy, France and Spain make about half of the world’s wine.
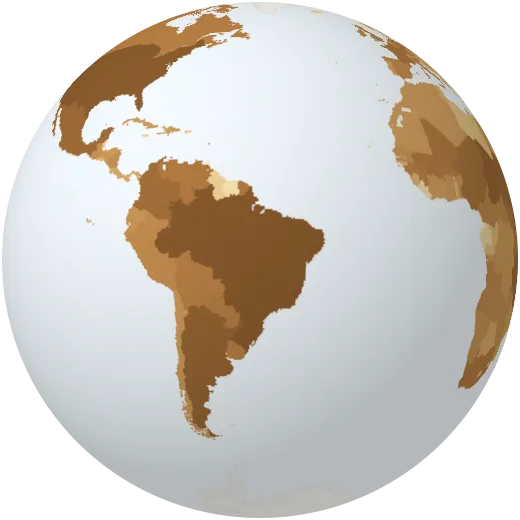
Cattle
Number of cattle. There are about 1.5 billion; more than a quarter live in Brazil and India.
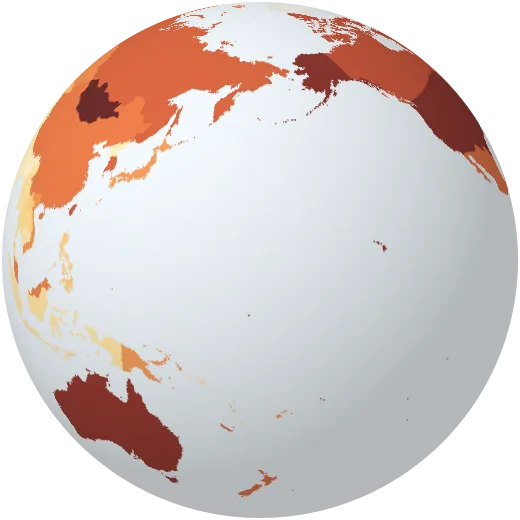
Meat consumption
Meat available to eat per person per year. Diets range from under 10 kg to more than 100 kg.
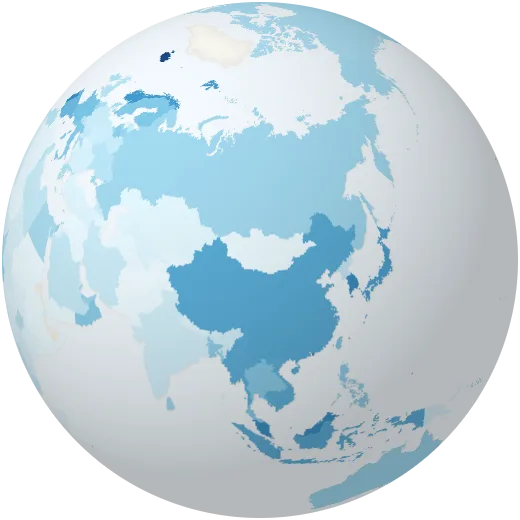
Fish and seafood eaten
Fish and seafood available to eat per person per year.
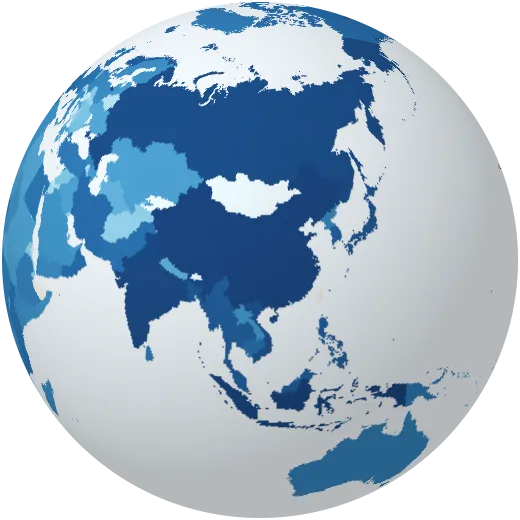
Fishing
Wild fish and seafood caught each year. About a third of fish stocks are now fished beyond sustainable levels.
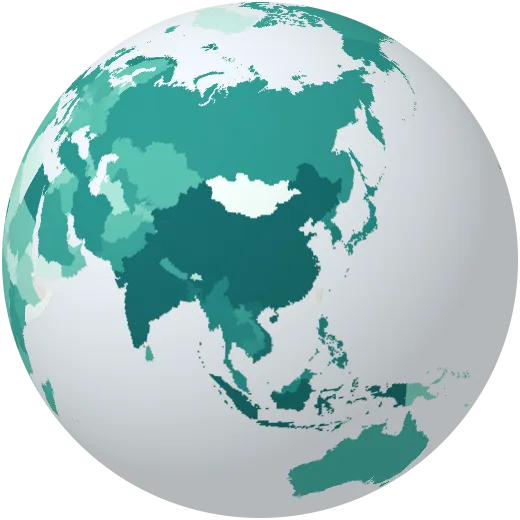
Fish farming
Fish, shellfish and seaweed raised in farms each year. China produces about 60% of the world total.
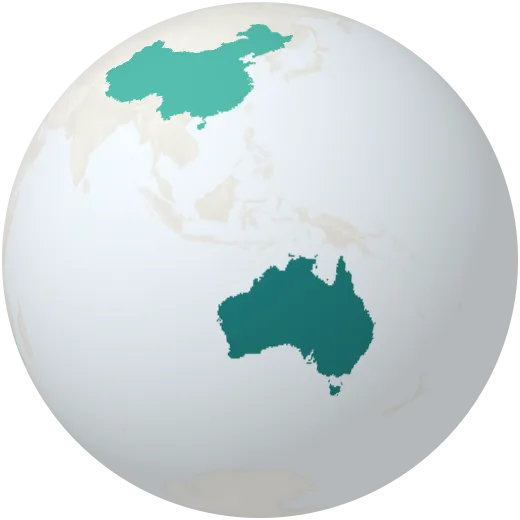
Lithium
Lithium mined each year, the key metal in batteries for electric cars. Australia, Chile and China mine most of it.
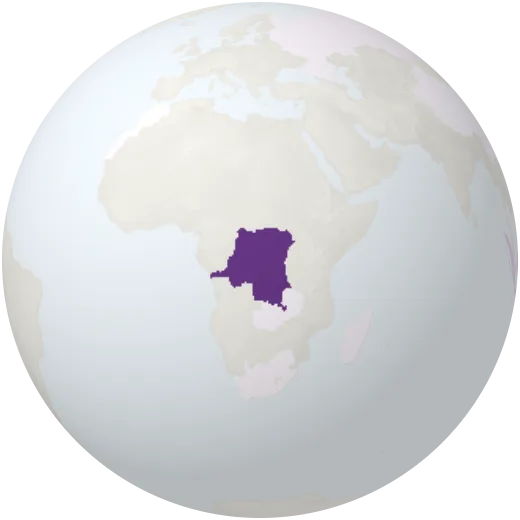
Cobalt
Cobalt mined each year, used in batteries. About three quarters comes from the Democratic Republic of the Congo.
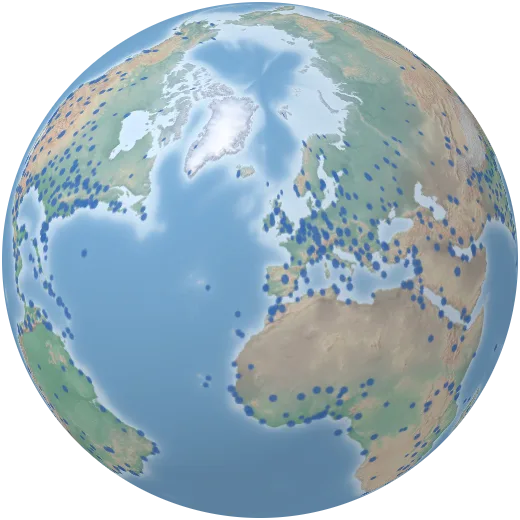
Airports
Major airports around the world.
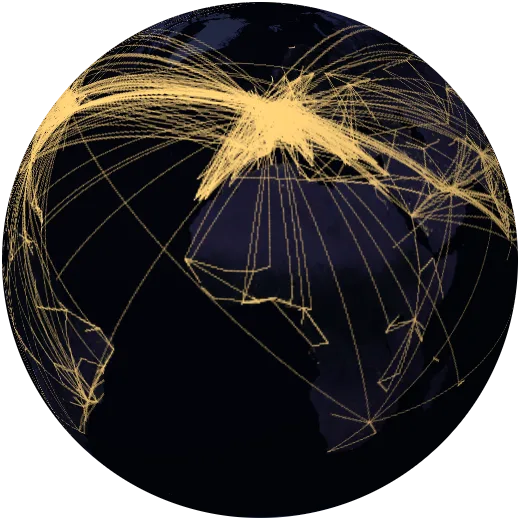
Flight routes
The 6,000 busiest air routes, weighted by how many airlines fly them.
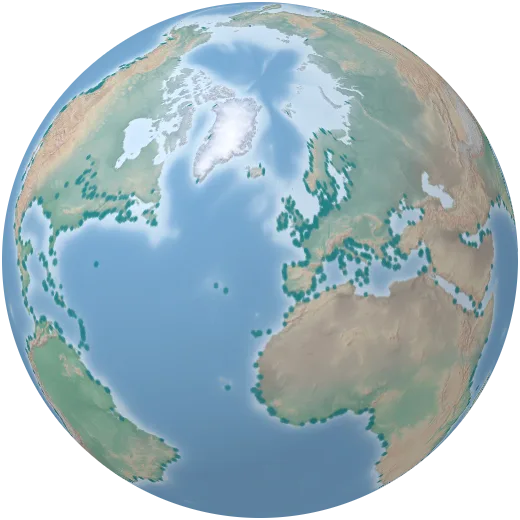
Seaports
Major seaports, the gateways for about 80% of world trade by volume.
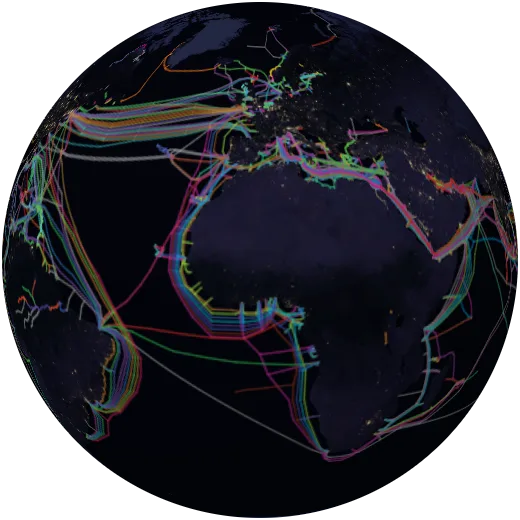
Internet cables
The undersea fibre-optic cables that carry almost all intercontinental internet traffic, each drawn in its operator’s colour.
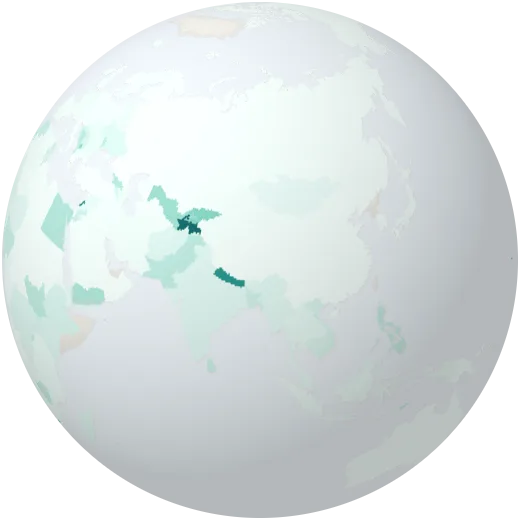
Money sent home
Money that migrants working abroad send home, as a share of the economy. In some countries it passes a quarter of GDP.
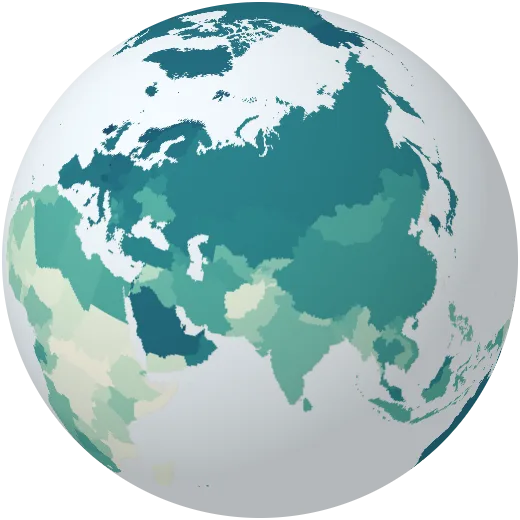
Income per person, adjusted for prices
GDP per person adjusted for what money buys in each country (purchasing power parity).
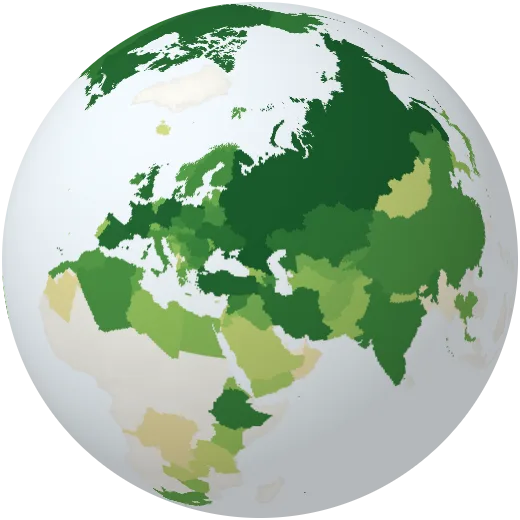
Barley
Barley harvested each year, for animal feed and beer. Russia, Australia and France grow the most.
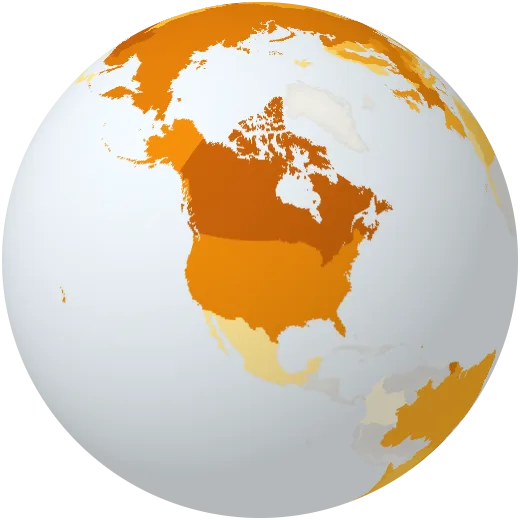
Rapeseed
Rapeseed (canola) harvested each year, for cooking oil and biodiesel. Canada grows the most.
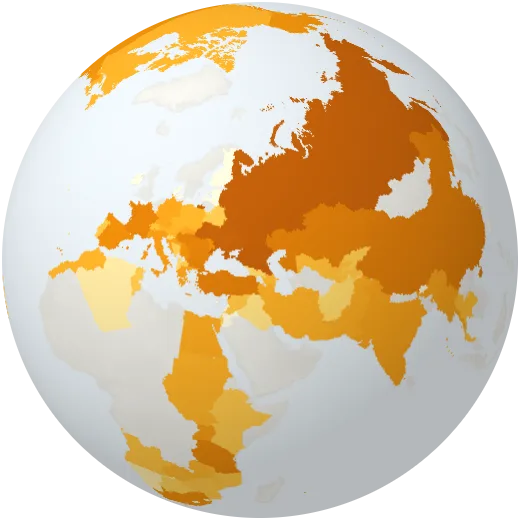
Sunflower seeds
Sunflower seeds harvested each year. Russia and Ukraine grow about half of the world’s crop.
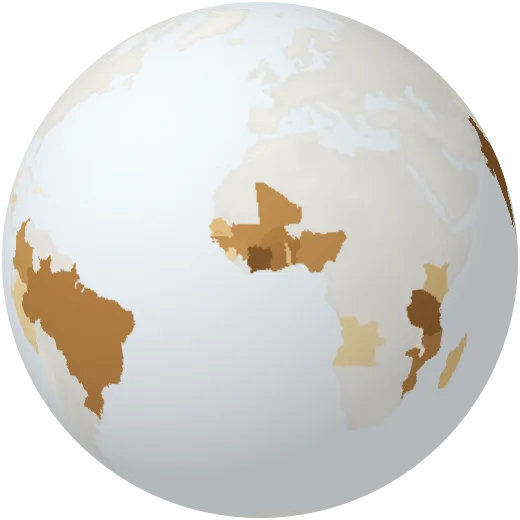
Cashew nuts
Cashew nuts harvested each year. Côte d’Ivoire and India are the largest growers.
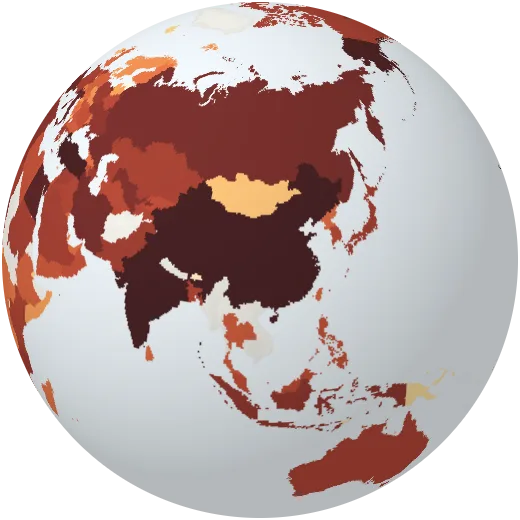
Tomatoes
Tomatoes harvested each year. China grows about a third of them.
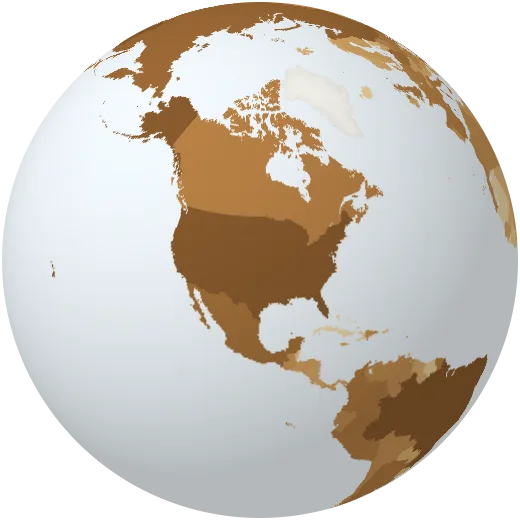
Chicken meat
Chicken meat produced each year. Poultry is now the most produced meat in the world.
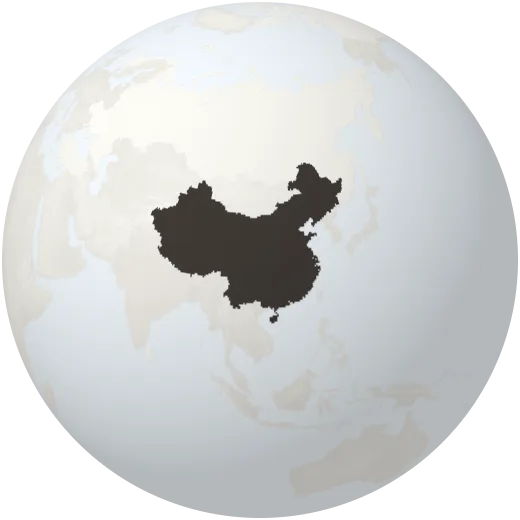
Graphite
Natural graphite mined each year, the main material in battery anodes. China mines about three quarters of it.
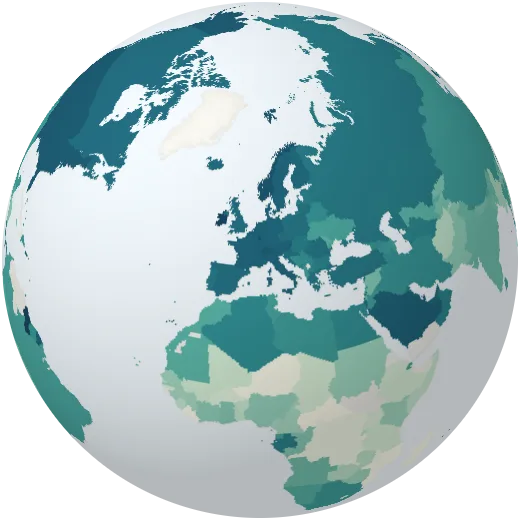
Output per worker
What each worker produces in a year, adjusted for prices.
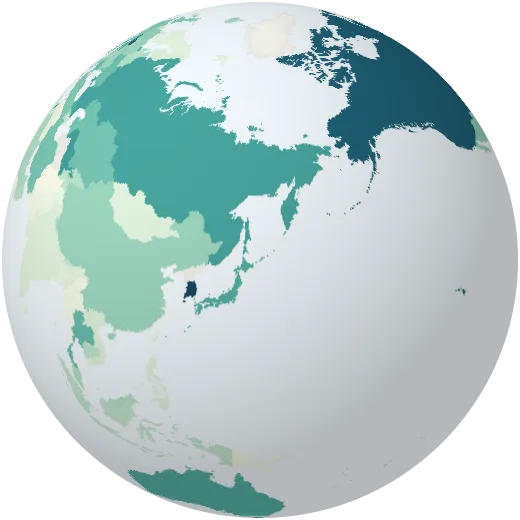
Cash machines
Cash machines per 100,000 adults.
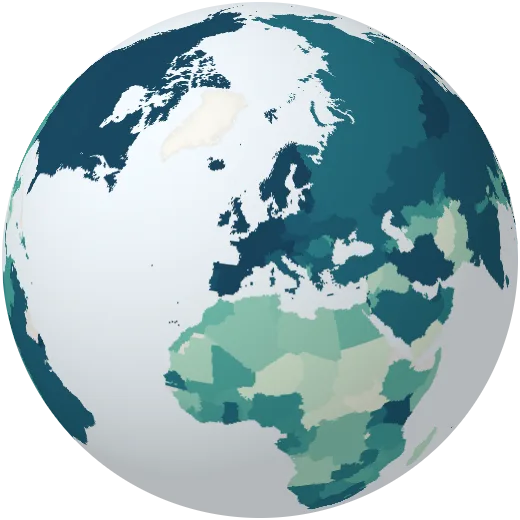
Bank accounts
Share of adults with an account at a bank or a mobile-money service.
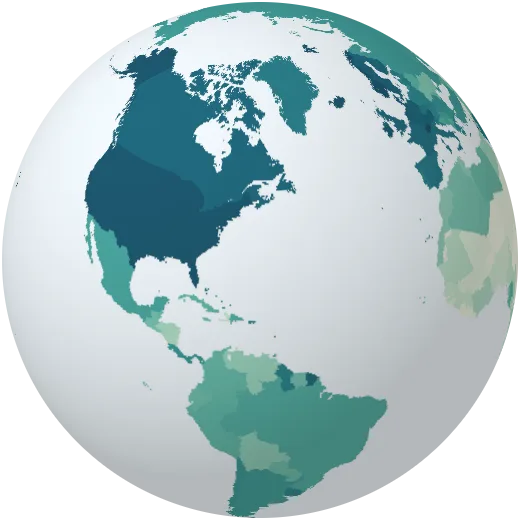
National income per person
Gross national income per person in dollars, the measure the World Bank uses to rank countries.
Growth per person
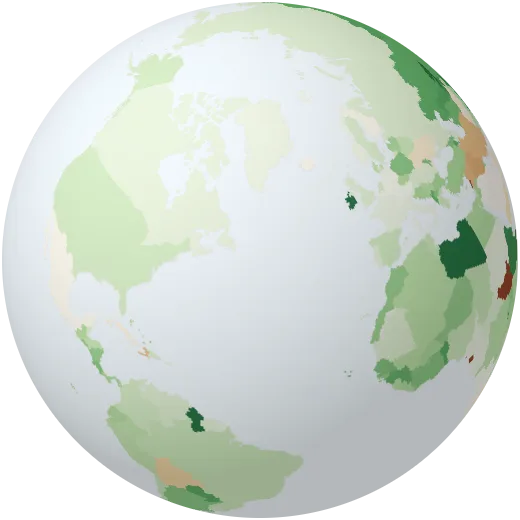
How fast the economy grows per person each year, after inflation.
Inflation
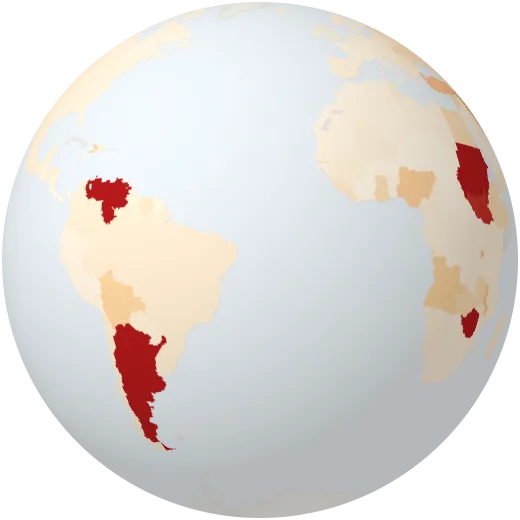
How fast consumer prices rise each year.
Imports
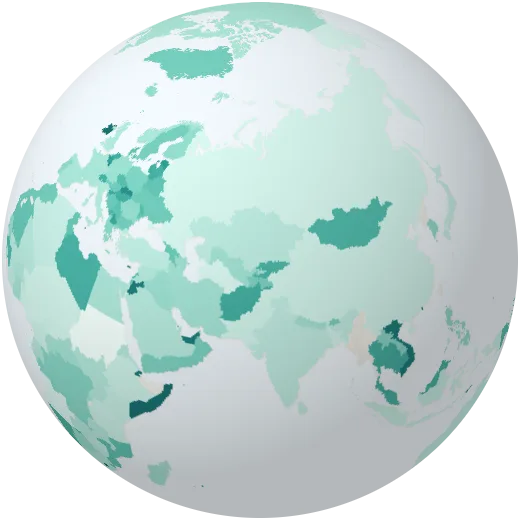
Imports of goods and services as a share of the economy.
Trade openness
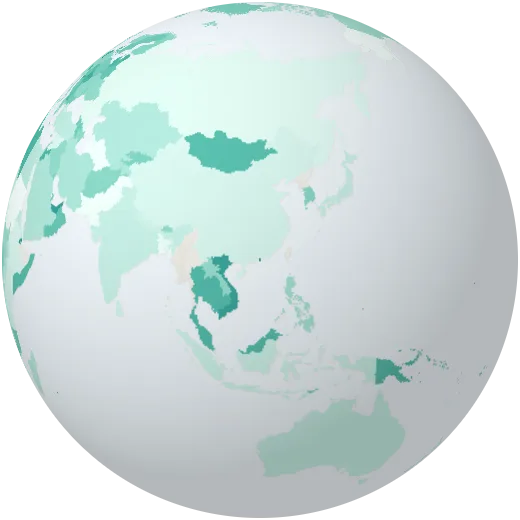
Exports plus imports as a share of the economy. Small trading hubs exceed 300%.
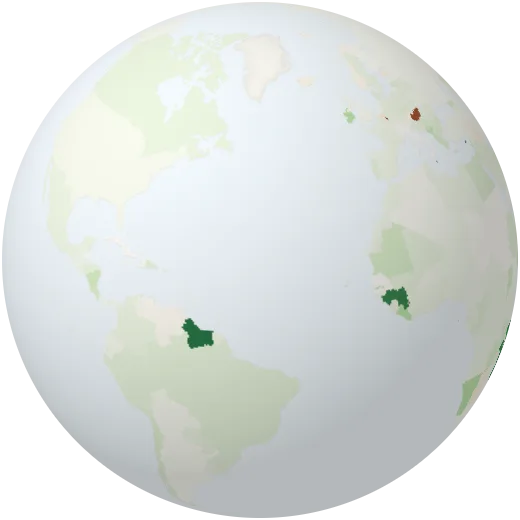
Foreign investment
Money foreign companies invested in the country, as a share of the economy.
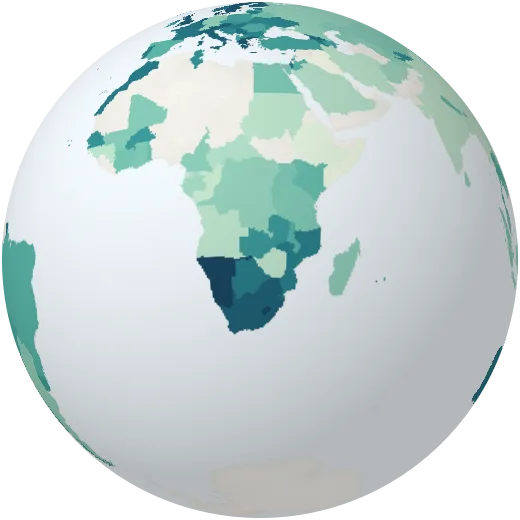
Tax revenue
Taxes collected by the central government as a share of the economy.
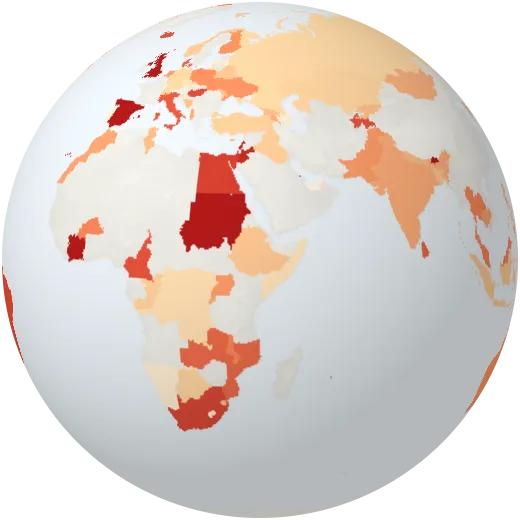
Government debt
Central government debt as a share of the economy.
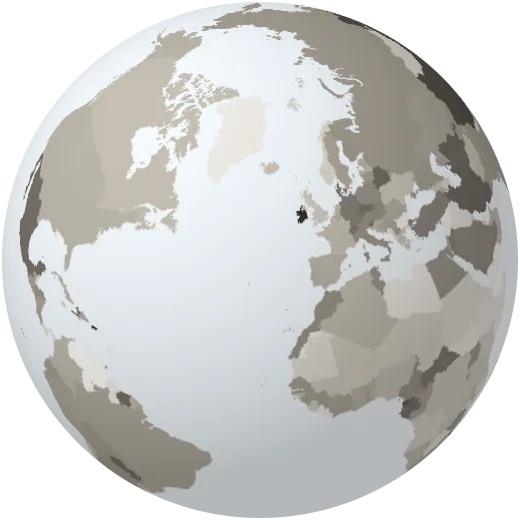
Manufacturing
Factories’ share of the economy.
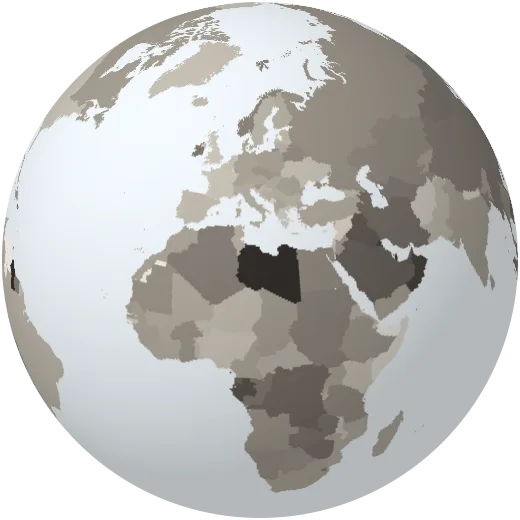
Industry
Industry, mining, construction and utilities as a share of the economy.
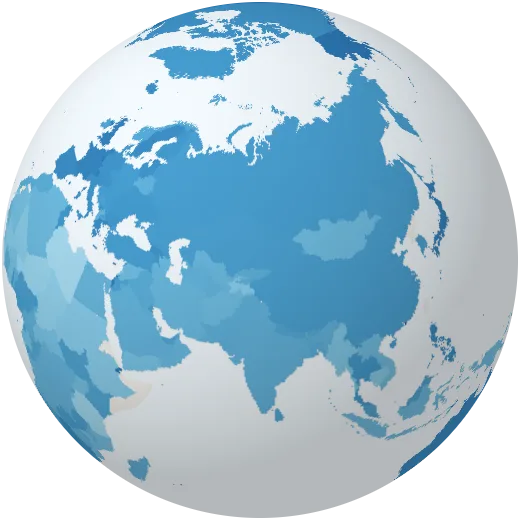
Services
Services as a share of the economy.
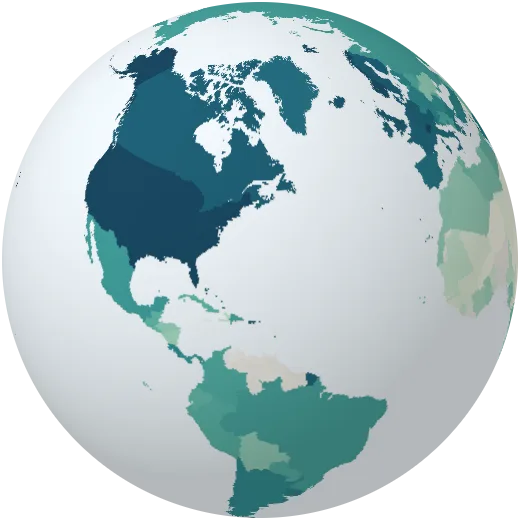
Household spending
What households spend per person each year, in 2015 dollars.
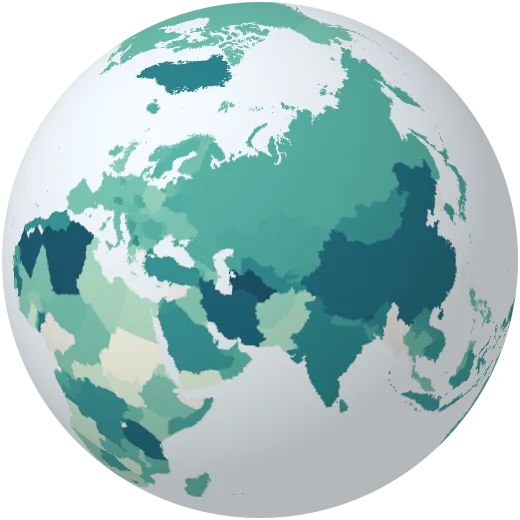
Investment
Spending on buildings, machines and infrastructure as a share of the economy.
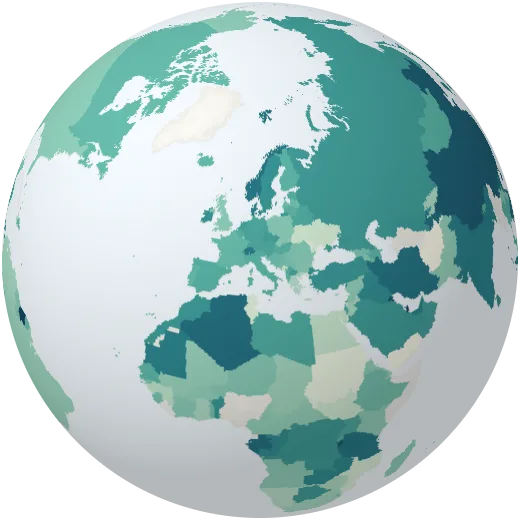
Savings
The share of national income that is saved rather than spent.
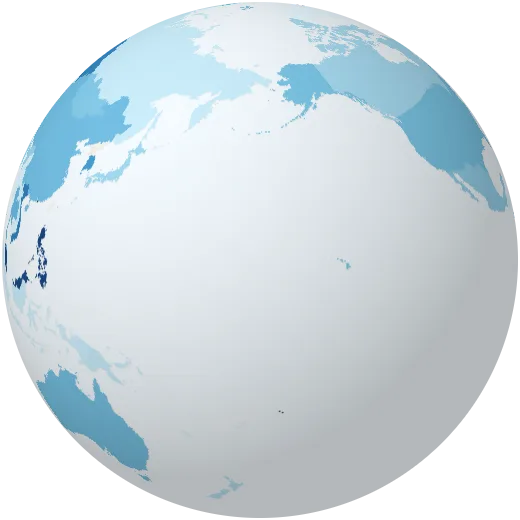
High-tech exports
Share of manufactured exports that are high-tech: chips, aircraft, medicines, computers.
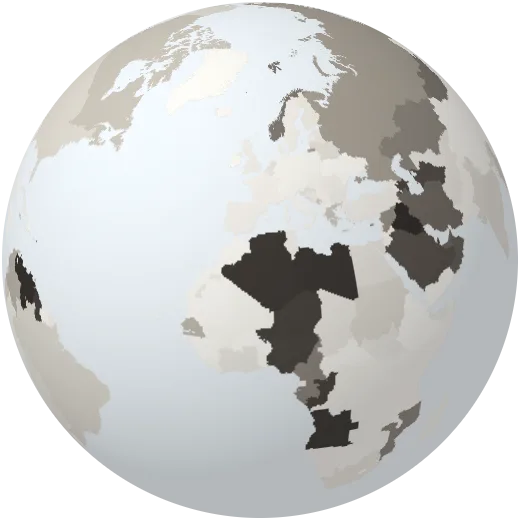
Fuel exports
Share of exported goods that are oil, gas and coal.
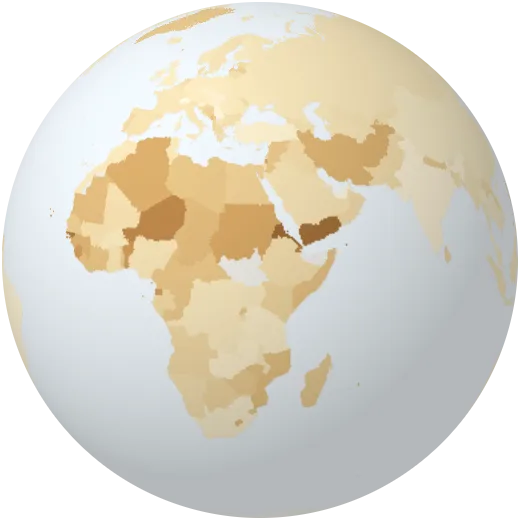
Food imports
Share of imported goods that are food.
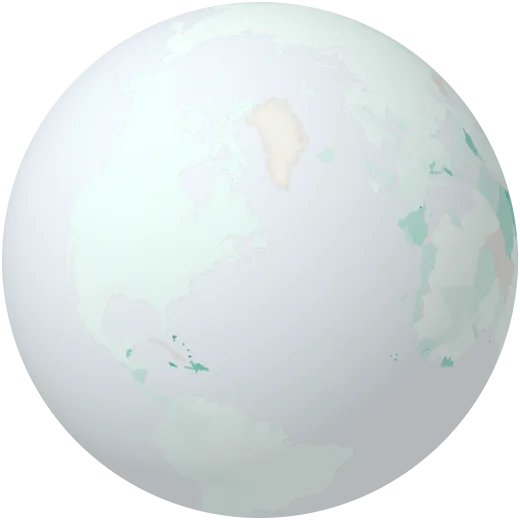
Income from tourism
What foreign visitors spend, as a share of everything the country exports.
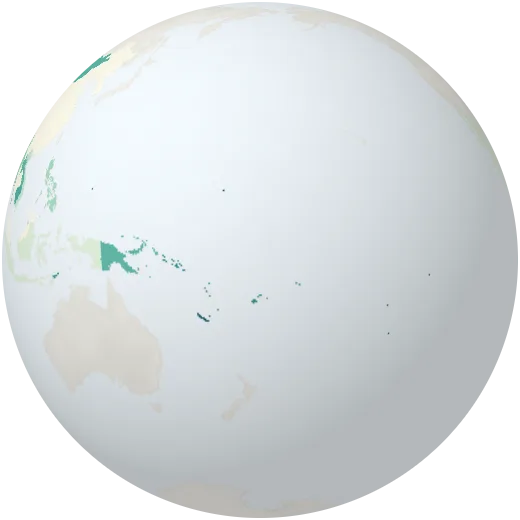
Aid received
Development aid received per person.
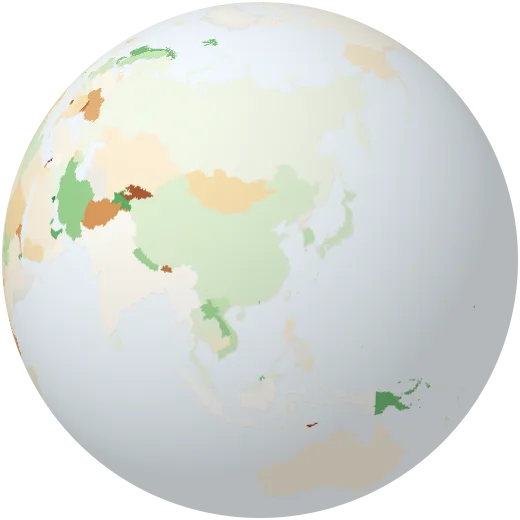
Current account
Whether a country earns more from the world than it spends abroad (surplus) or less (deficit).
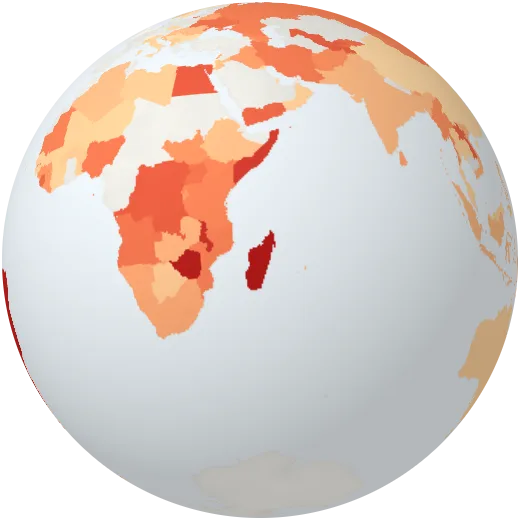
Lending interest rate
Interest banks charge on loans.
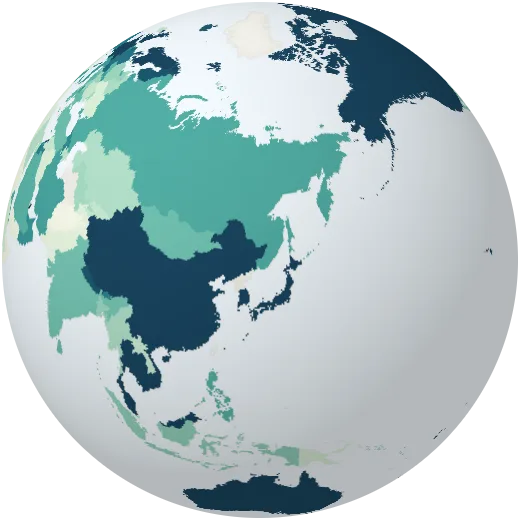
Bank lending
Loans to households and companies as a share of the economy.
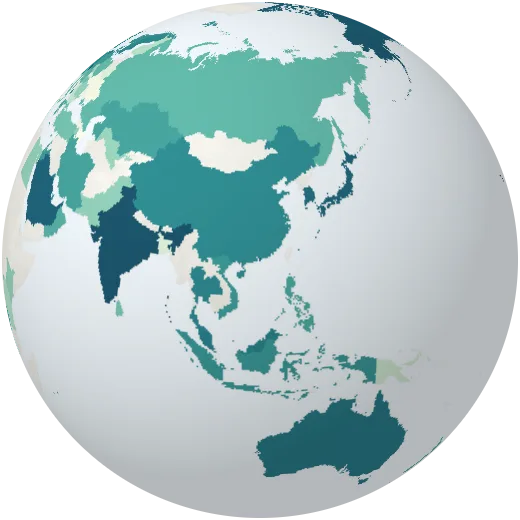
Stock market value
Value of listed companies as a share of the economy.
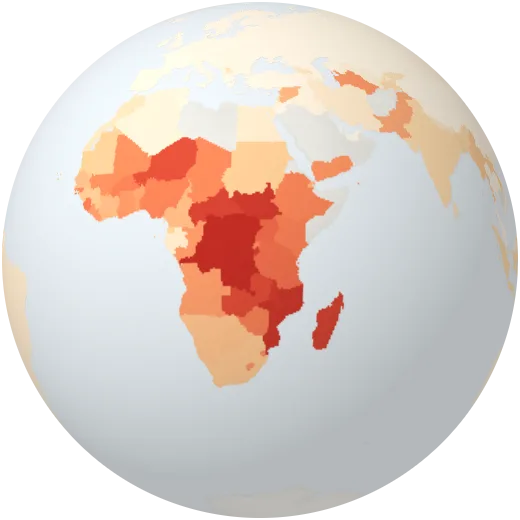
Poverty below $4.20 a day
Share of people living on less than $4.20 a day, adjusted for prices.
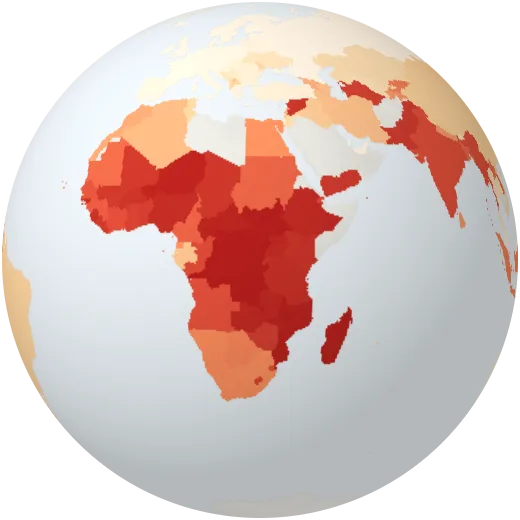
Poverty below $8.30 a day
Share of people living on less than $8.30 a day, adjusted for prices.
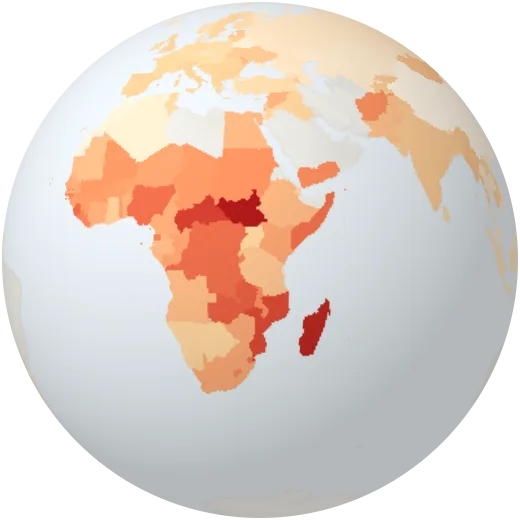
Poverty by national line
Share of people below the poverty line each country sets for itself.
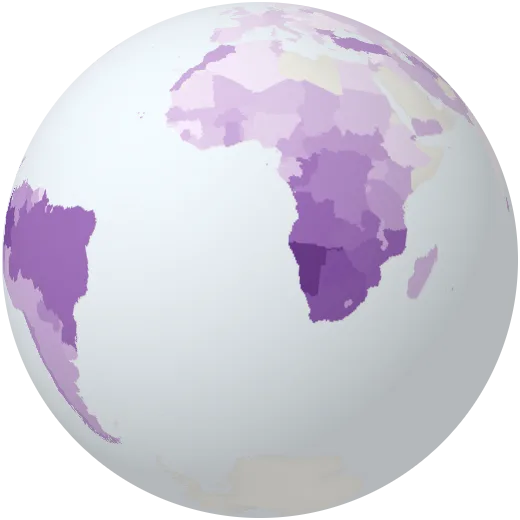
Income of the richest tenth
Share of all income that goes to the richest 10% of people.
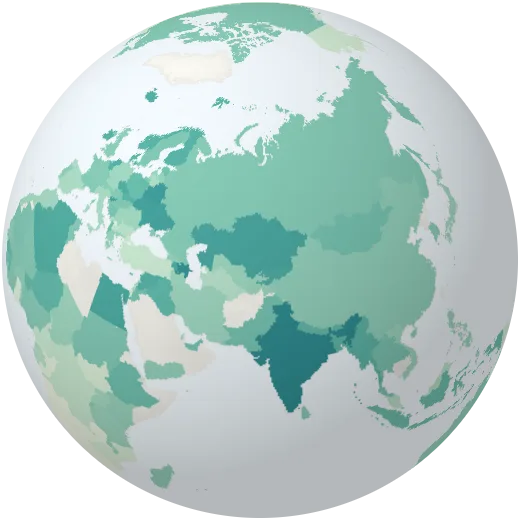
Income of the poorest fifth
Share of all income that goes to the poorest 20% of people.
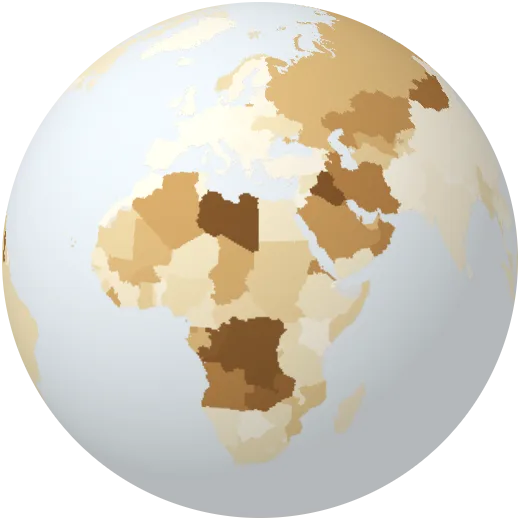
Natural resource income
Profit from oil, gas, coal, minerals and timber as a share of the economy.
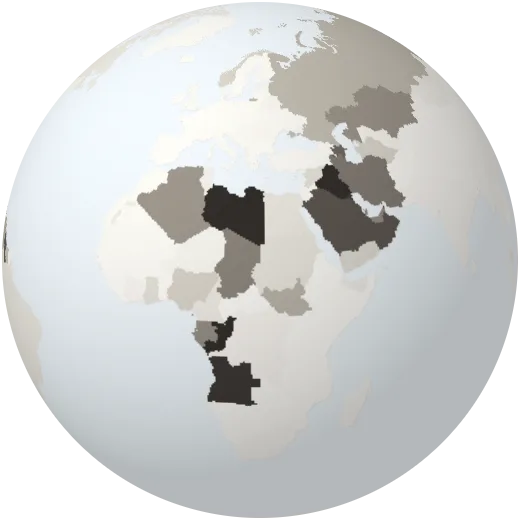
Oil income
Profit from oil as a share of the economy.
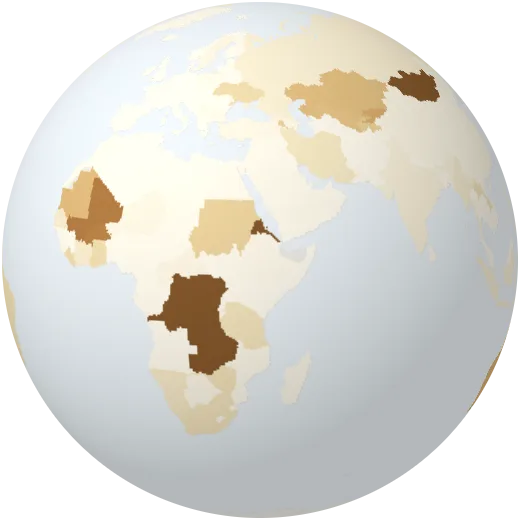
Mining income
Profit from metals and minerals as a share of the economy.
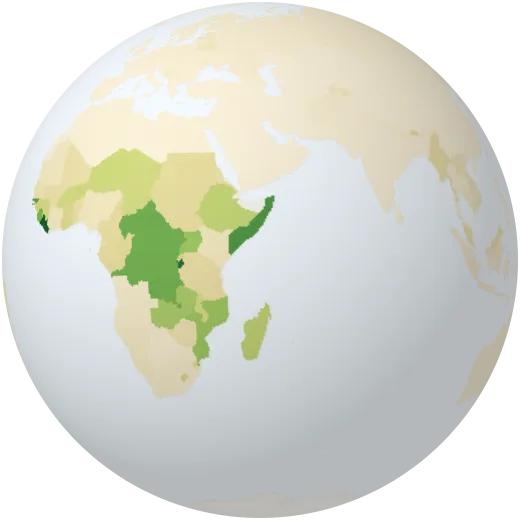
Timber income
Value of wood cut from forests as a share of the economy.
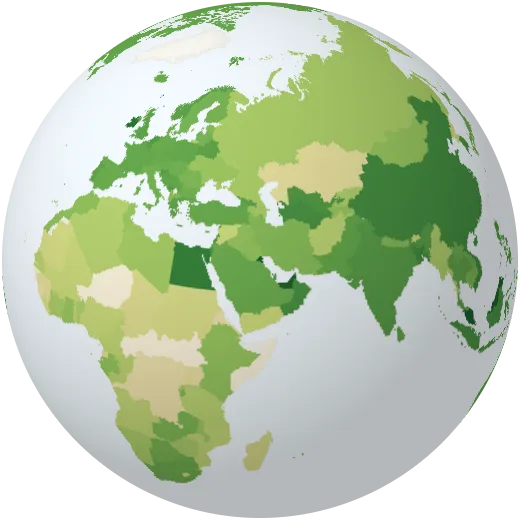
Fertiliser use
Fertiliser used per hectare of farmland.
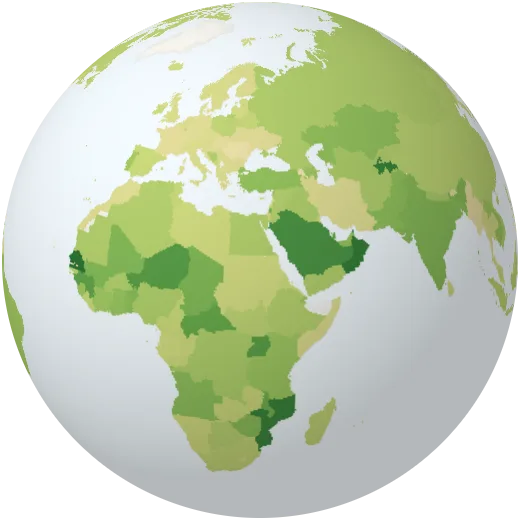
Food production
How much food a country produces compared with 2014–2016.
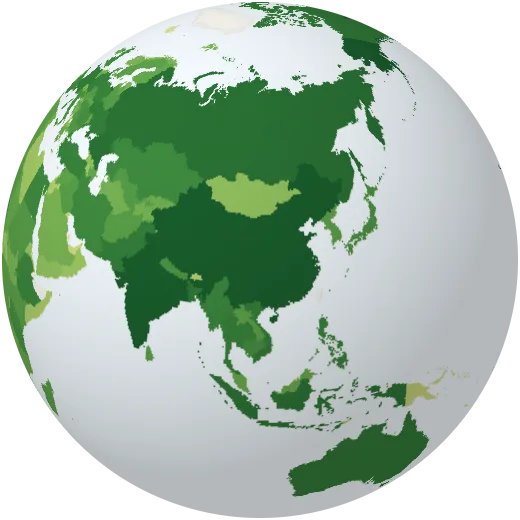
Cereal harvest
All grain harvested each year: wheat, rice, maize, barley and more.
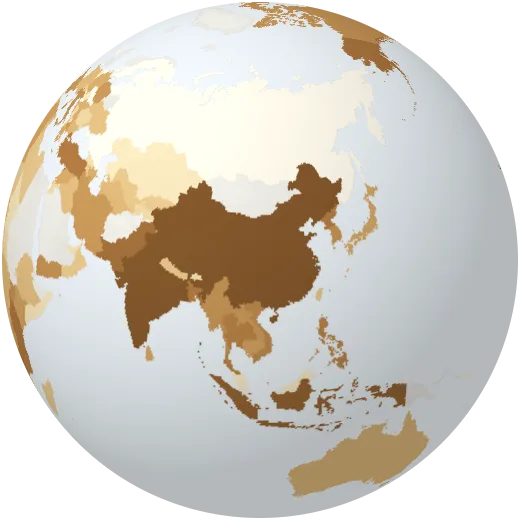
Tobacco
Tobacco harvested each year, from FAO farm statistics.
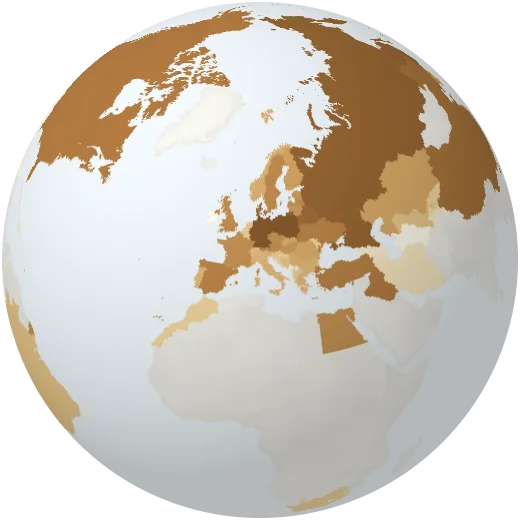
Rye
Rye harvested each year, from FAO farm statistics.
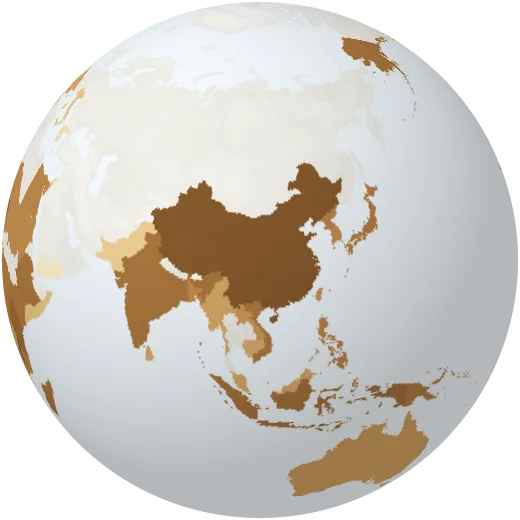
Sweet potatoes
Sweet potatoes harvested each year, from FAO farm statistics.
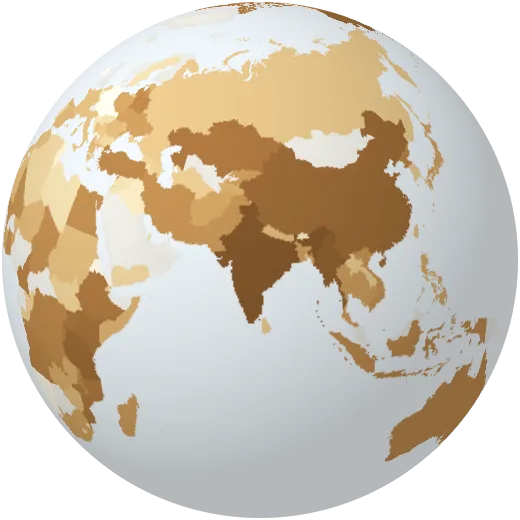
Dry beans
Dry beans harvested each year, from FAO farm statistics.
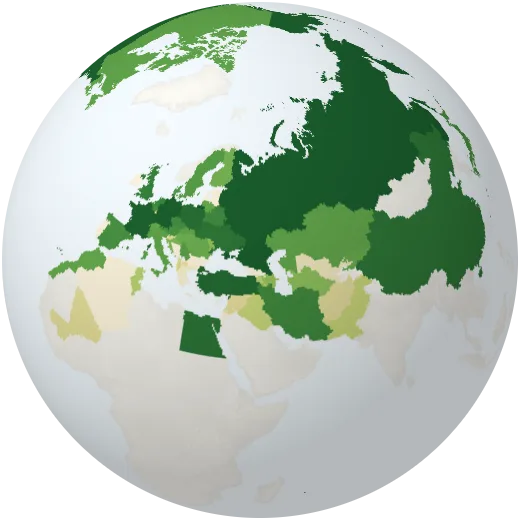
Sugar beet
Sugar beet harvested each year, from FAO farm statistics.
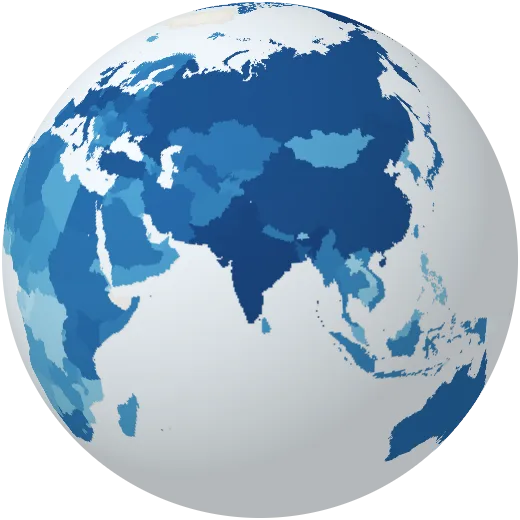
Milk
Milk produced each year by cows, buffalo, goats and sheep, from FAO farm statistics.
Energy
Every large power plant on Earth and how each country makes electricity.
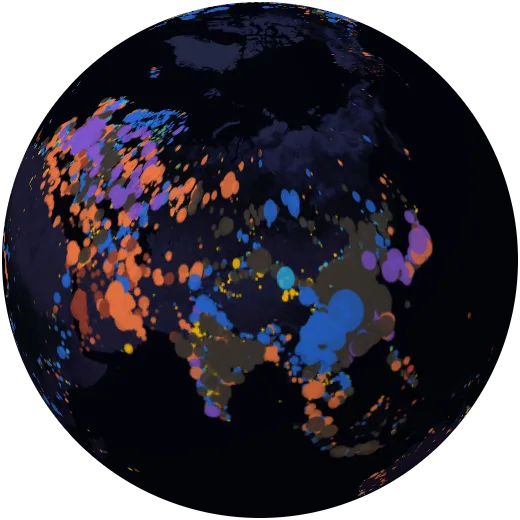
Power plants
About 35,000 power plants in 167 countries, coloured by fuel and sized by capacity (WRI database, 2021).
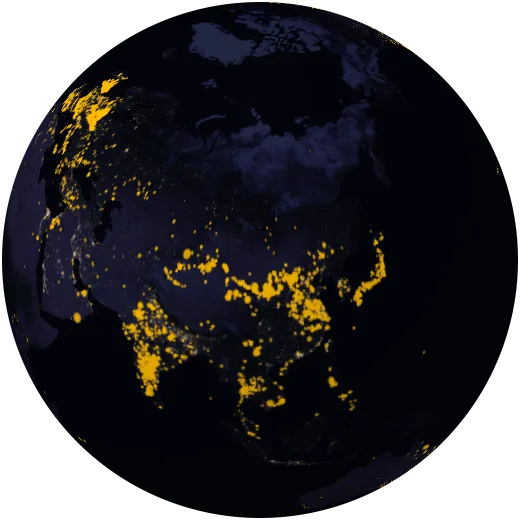
Solar farms
Solar power plants recorded up to 2021. Solar is now the fastest-growing source of electricity in history.
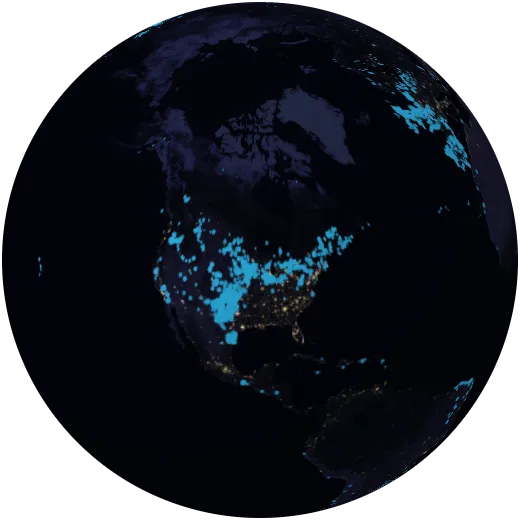
Wind farms
Onshore and offshore wind farms recorded up to 2021.
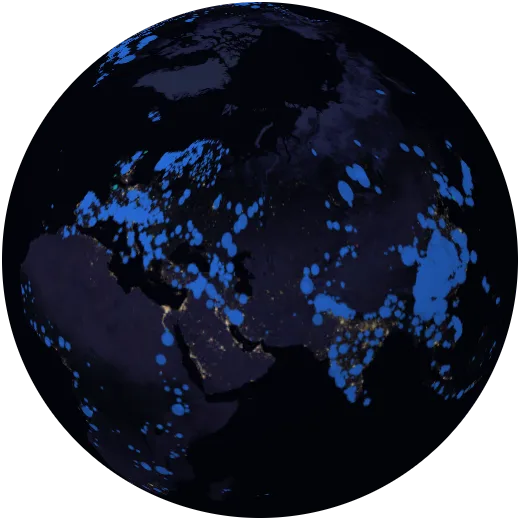
Hydropower
Hydroelectric dams and tidal plants, the largest source of renewable electricity.
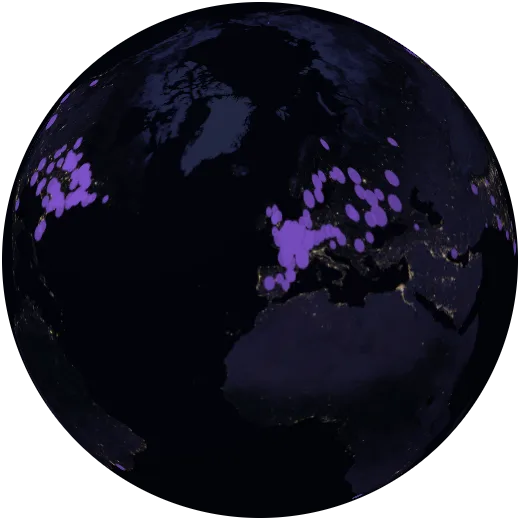
Nuclear power plants
Nuclear power stations, which make about a tenth of the world’s electricity with very low emissions.
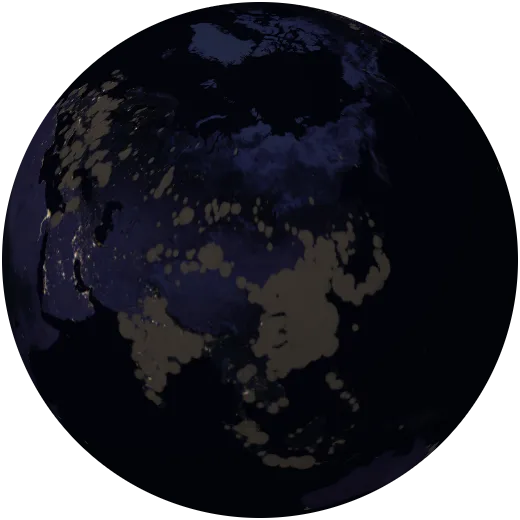
Coal power plants
Coal-fired power stations, still the largest source of electricity and of CO₂ from energy.
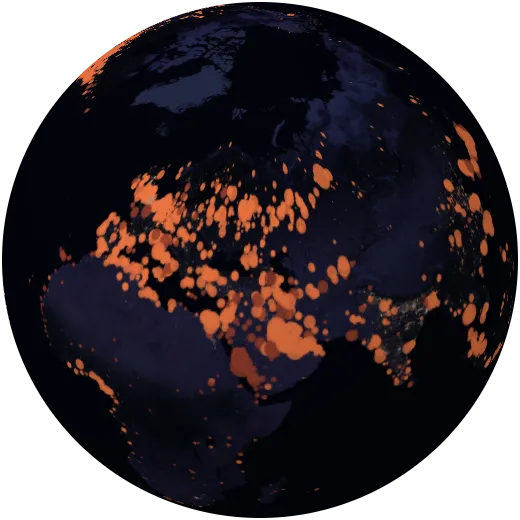
Gas and oil power plants
Power plants that burn natural gas or oil.
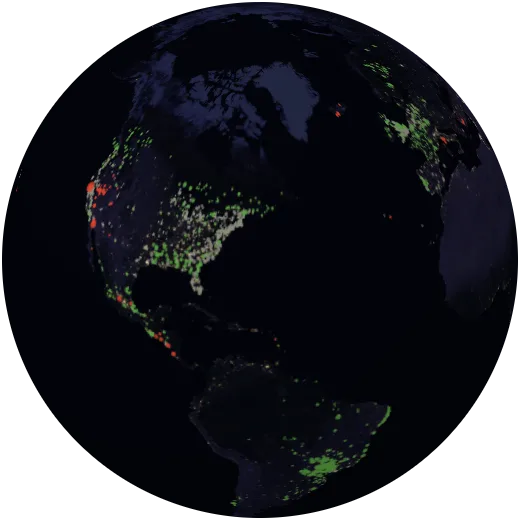
Geothermal and bioenergy
Plants that run on heat from the Earth, on wood and crop waste, or on rubbish.
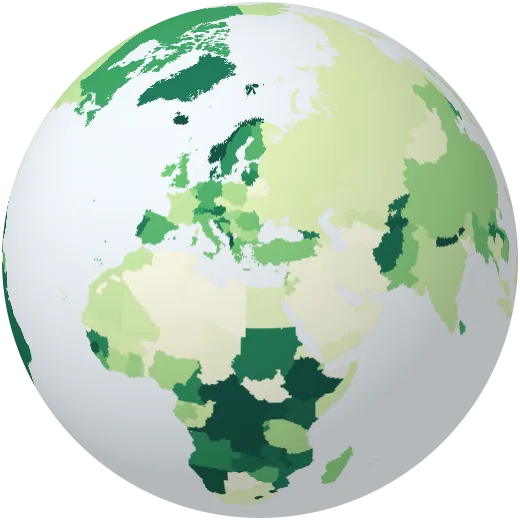
Renewable electricity
Share of electricity from solar, wind, hydro, bioenergy and other renewables.
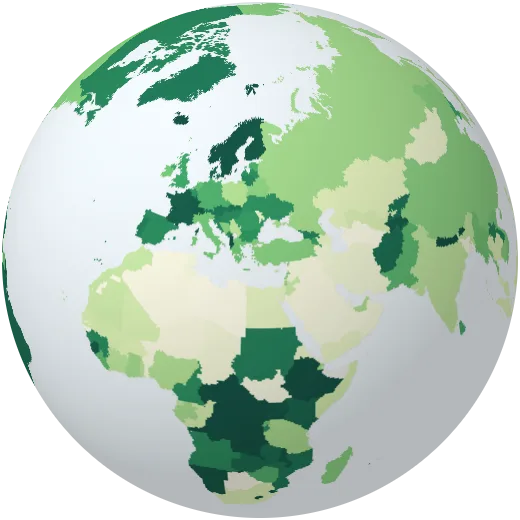
Low-carbon electricity
Share of electricity from renewables and nuclear combined.
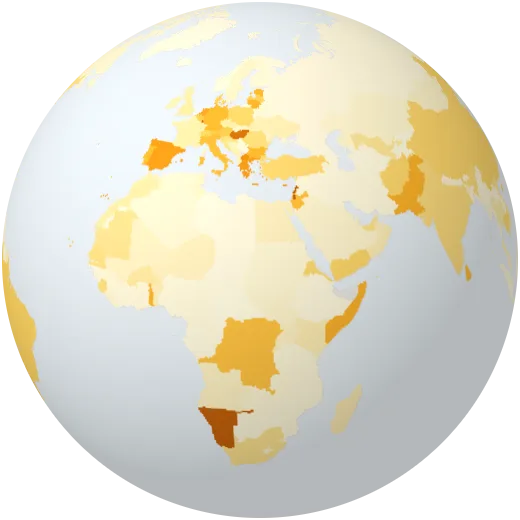
Solar share
Share of electricity from solar panels.
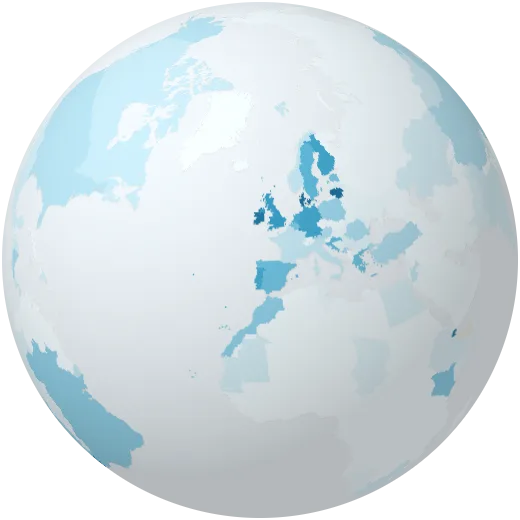
Wind share
Share of electricity from wind turbines.
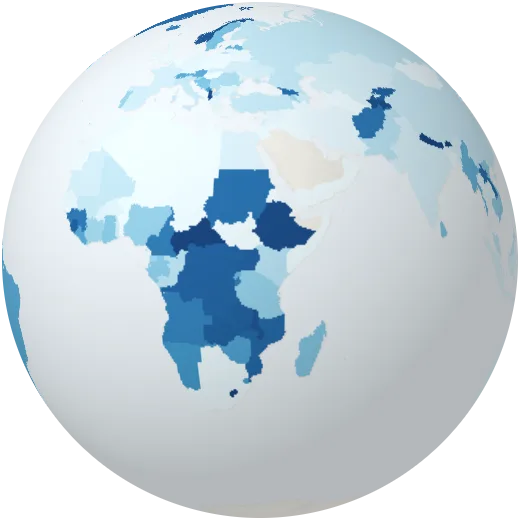
Hydro share
Share of electricity from hydropower.
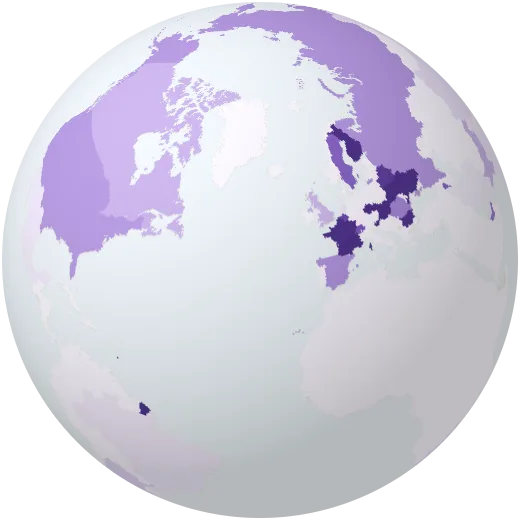
Nuclear share
Share of electricity from nuclear power. France leads at about two thirds.
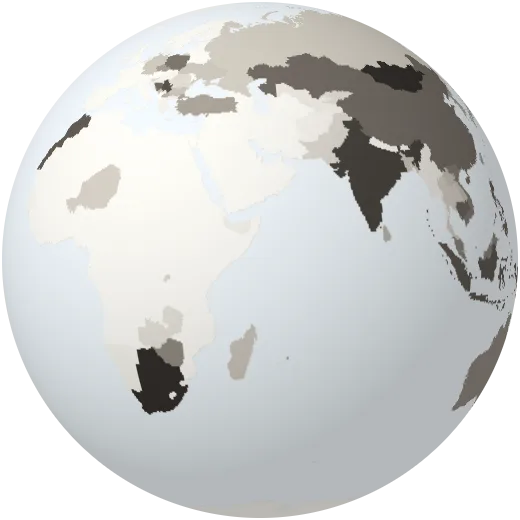
Coal share
Share of electricity from coal.
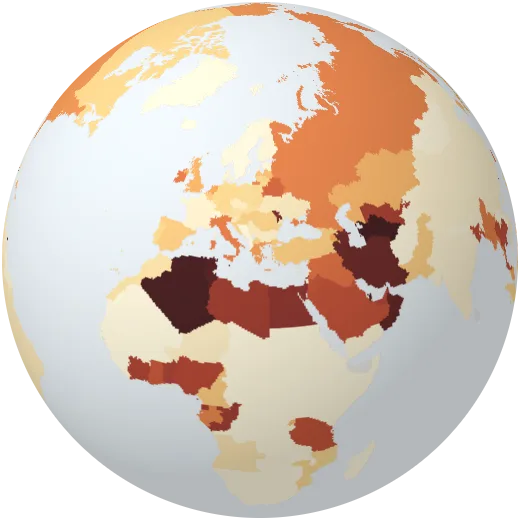
Gas share
Share of electricity from natural gas.
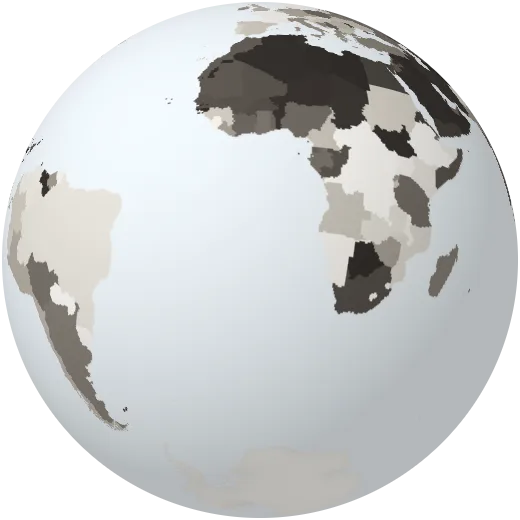
Fossil electricity
Share of electricity from coal, gas and oil.
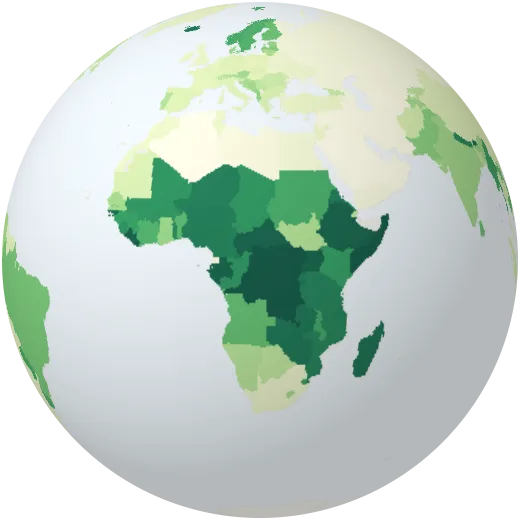
Renewables in all energy
Share of all energy used — for heat, transport and power — that comes from renewable sources, including traditional wood fuel.
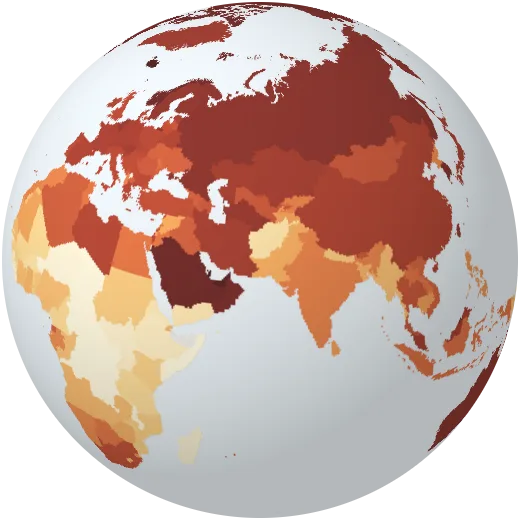
Energy use per person
Primary energy used per person each year, for heat, transport, industry and electricity.
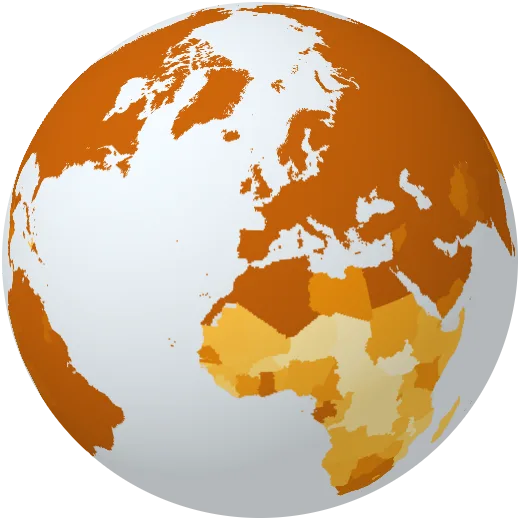
Access to electricity
Share of people with electricity at home. About 700 million people, most in sub-Saharan Africa, still live without it.
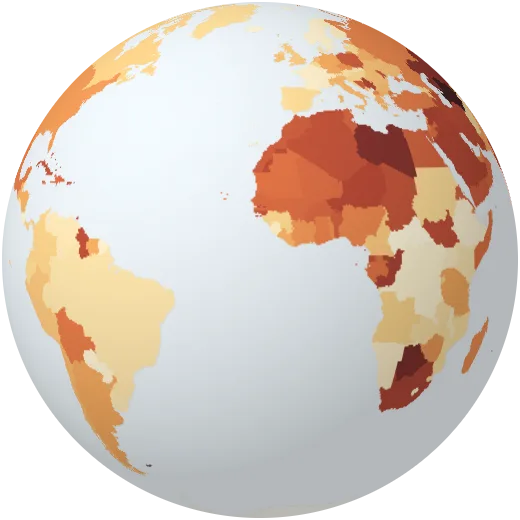
Carbon intensity of electricity
Grams of CO₂ emitted for each kilowatt-hour of electricity generated.
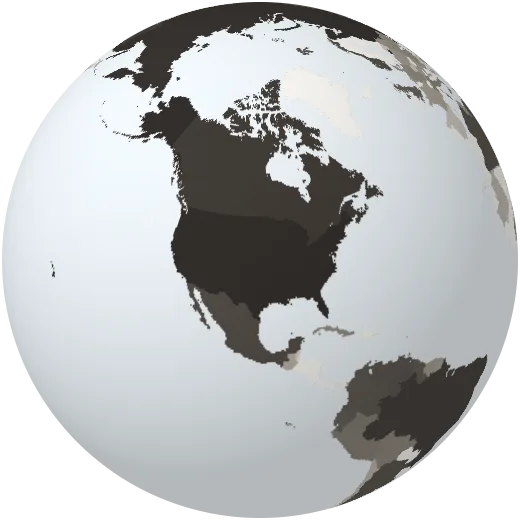
Oil production
Crude oil produced each year, measured as energy. The United States, Saudi Arabia and Russia pump the most.
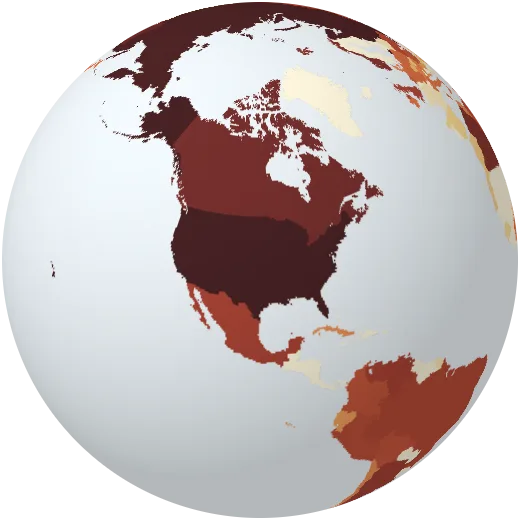
Gas production
Natural gas produced each year, measured as energy.
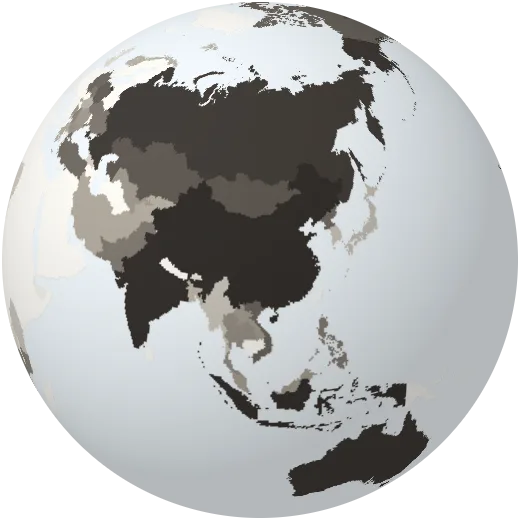
Coal production
Coal mined each year, measured as energy. China mines about half of the world’s coal.
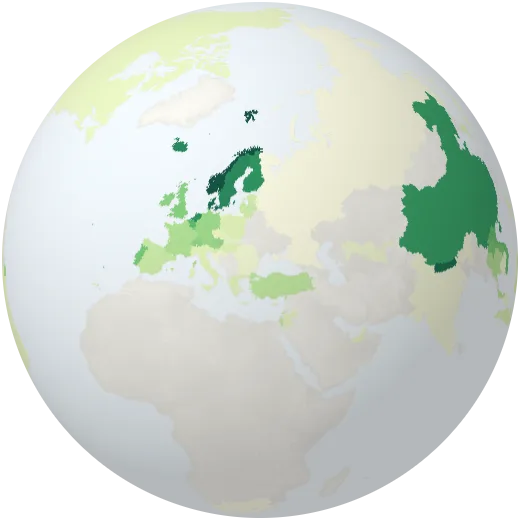
Electric cars
Share of new cars sold that are fully electric or plug-in hybrid. Norway passed 90% in 2024.
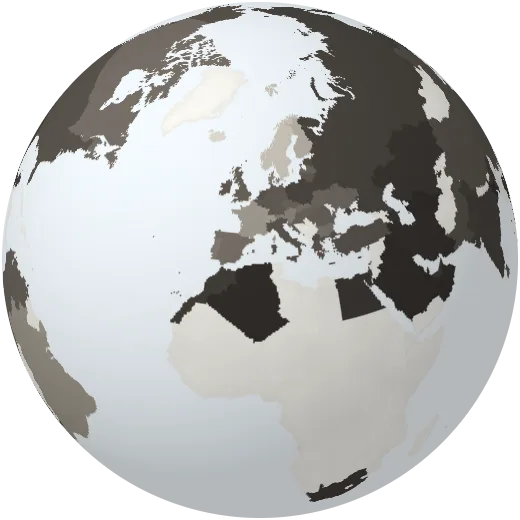
Fossil fuels in all energy
Share of all primary energy that comes from coal, oil and gas.
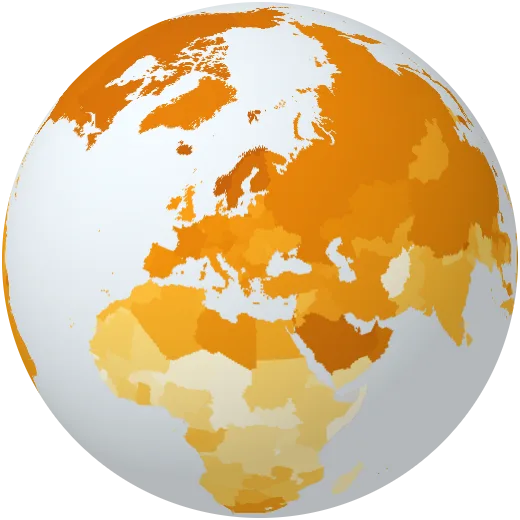
Electricity use per person
Electricity generated per person each year.
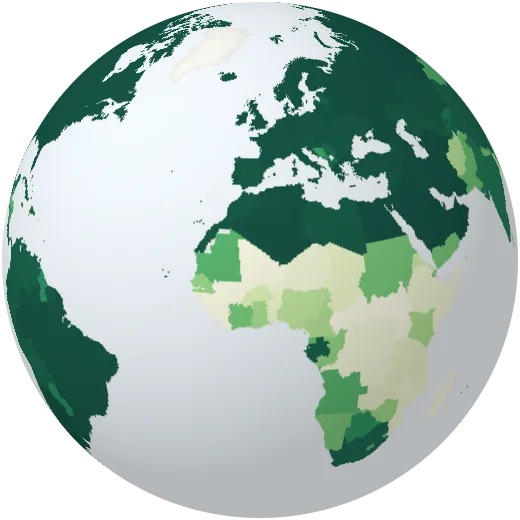
Clean cooking
Share of people who cook with clean fuels such as gas or electricity rather than wood or charcoal.
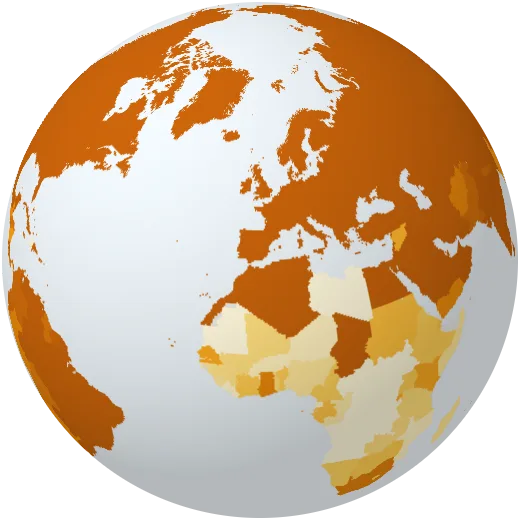
Electricity in the countryside
Share of people in the countryside with electricity at home.
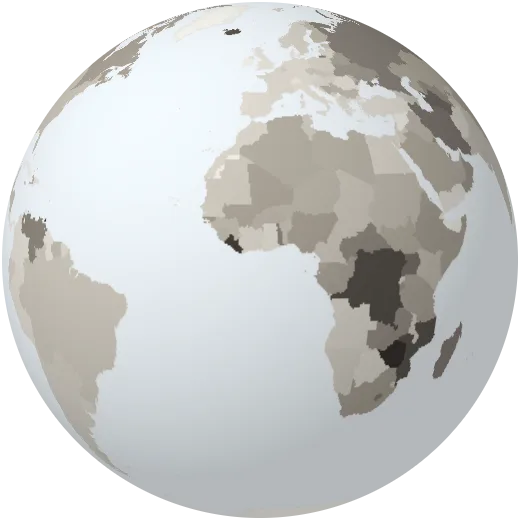
Energy intensity
Energy used for every dollar of economic output. Lower is more efficient.
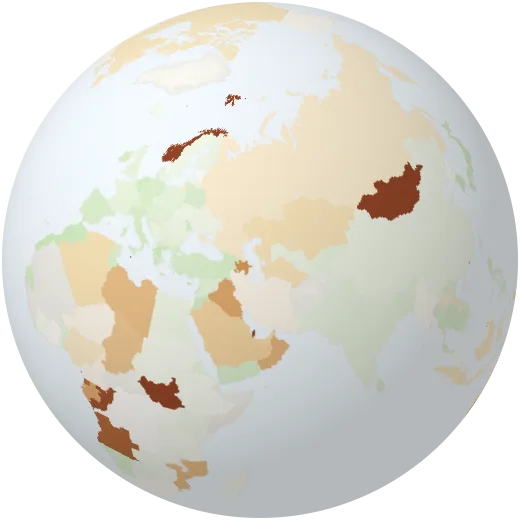
Energy imports
Share of energy bought abroad. Negative means the country exports energy.
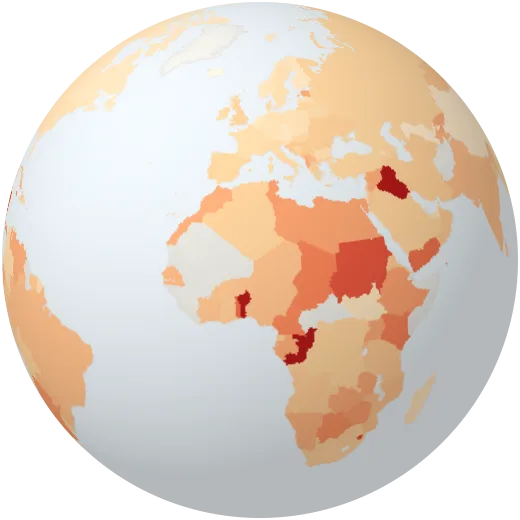
Power lost in the grid
Electricity lost between power plant and customer, including theft (until 2014).
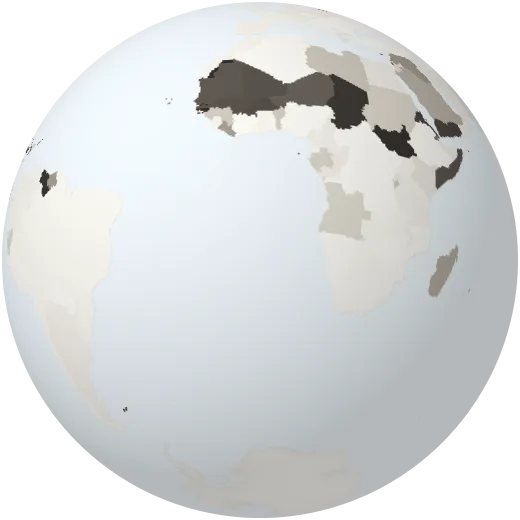
Oil share
Share of electricity made by burning oil, common on islands.
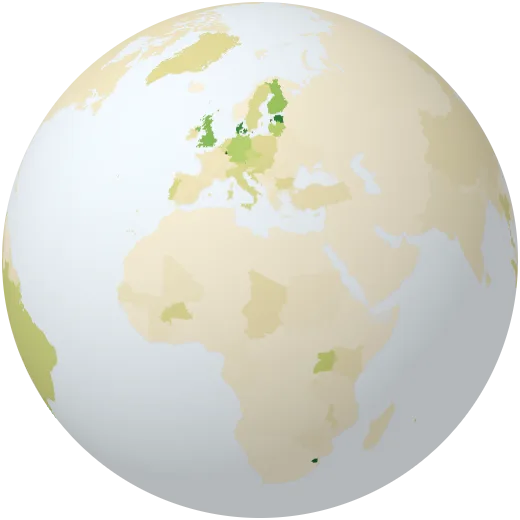
Bioenergy share
Share of electricity from burning wood, crops and waste.
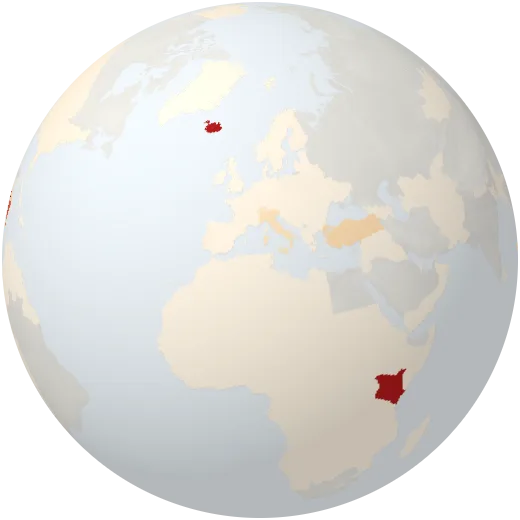
Geothermal and other
Share of electricity from geothermal, tidal and wave power.
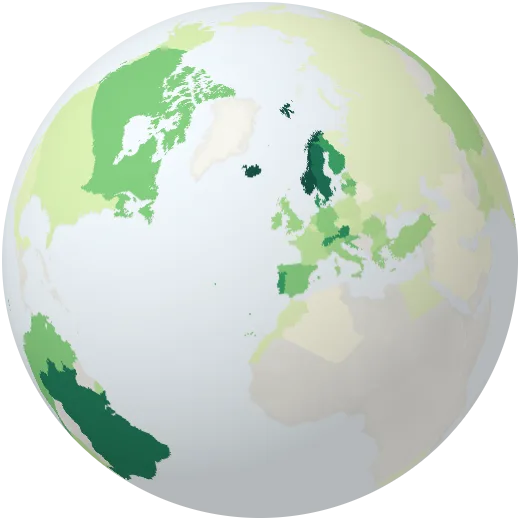
Renewables in all energy
Share of all energy, not just electricity, from renewable sources.
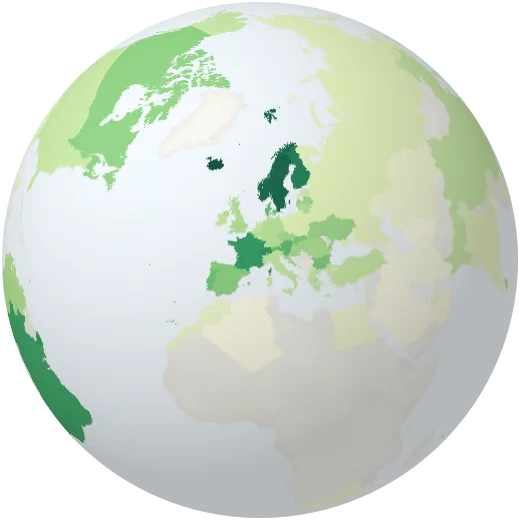
Low-carbon energy
Share of all energy from renewables and nuclear.
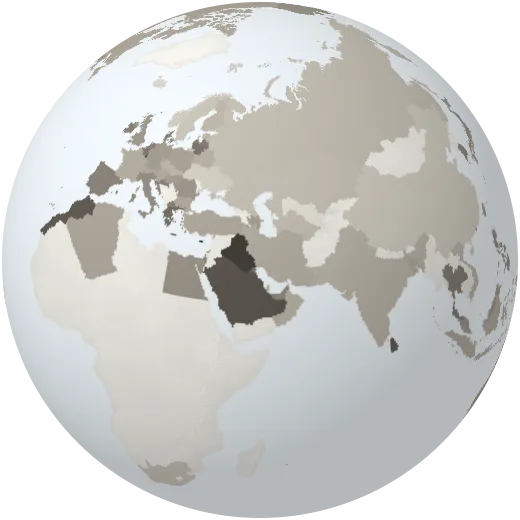
Oil in all energy
Share of all energy that comes from oil.
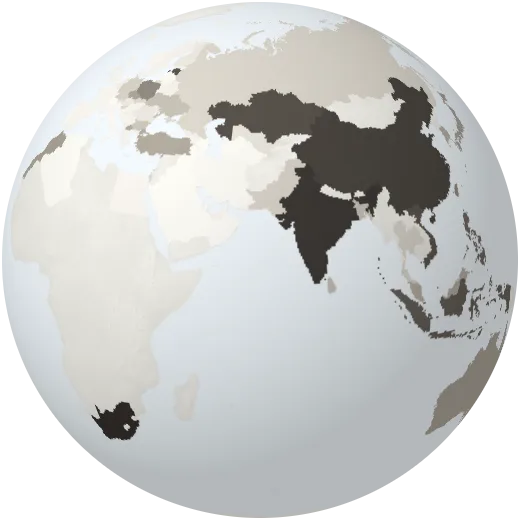
Coal in all energy
Share of all energy that comes from coal.
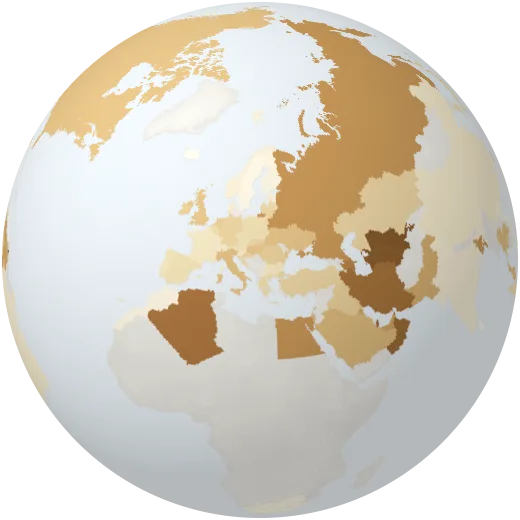
Gas in all energy
Share of all energy that comes from natural gas.
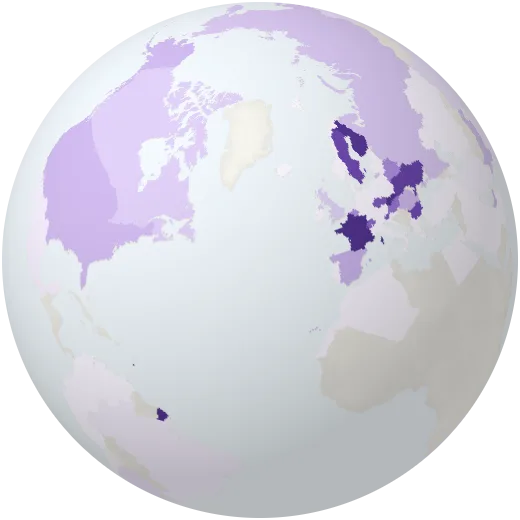
Nuclear in all energy
Share of all energy that comes from nuclear power.
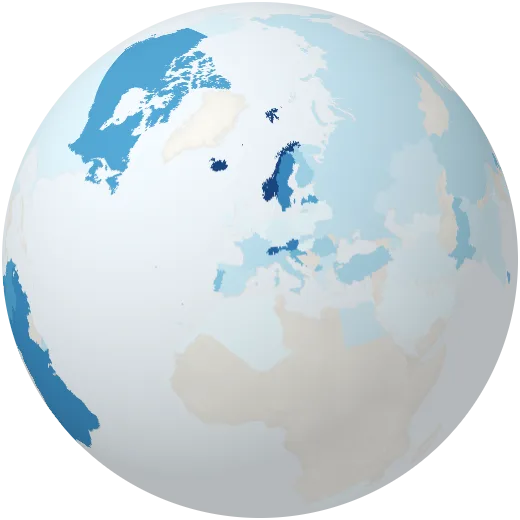
Hydro in all energy
Share of all energy that comes from hydropower.
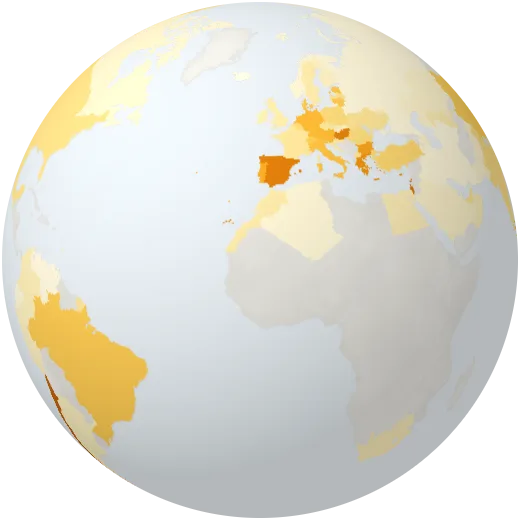
Solar in all energy
Share of all energy that comes from the sun.
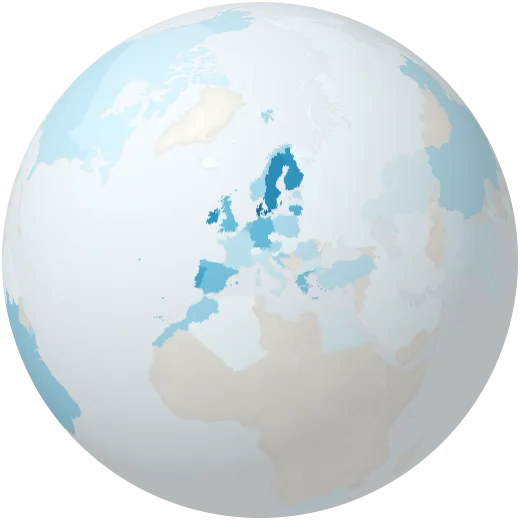
Wind in all energy
Share of all energy that comes from wind.
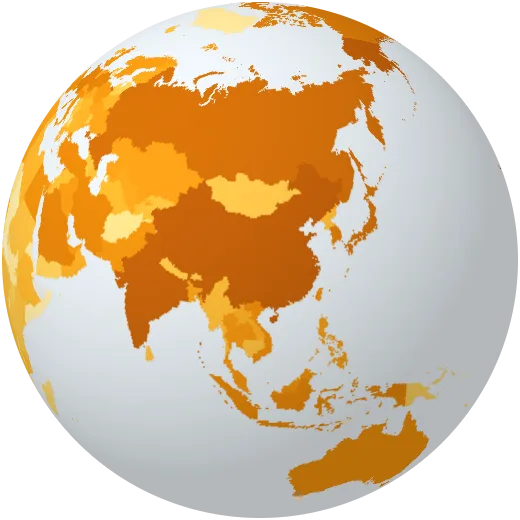
Electricity generated
All electricity generated in a year.
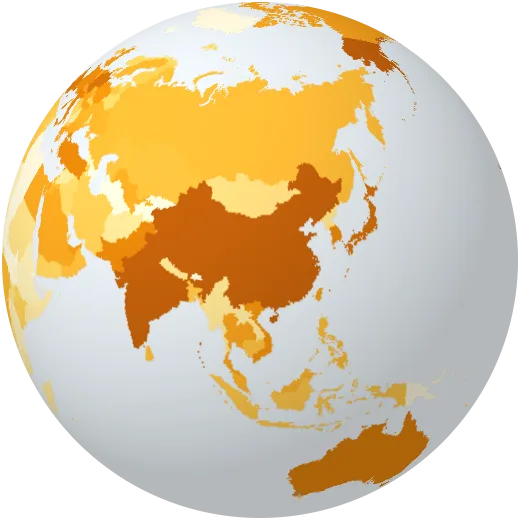
Solar power generated
Electricity generated by solar panels in a year.
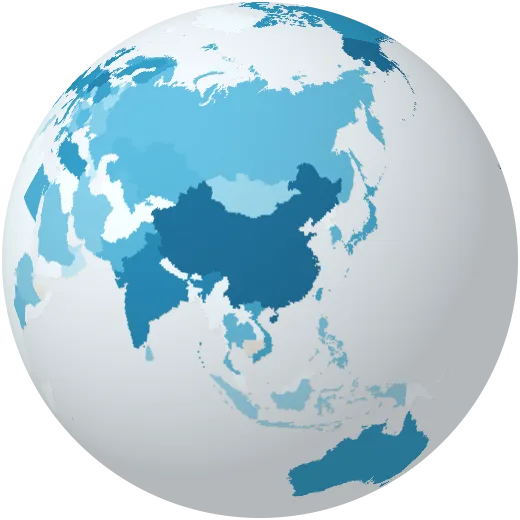
Wind power generated
Electricity generated by wind turbines in a year.
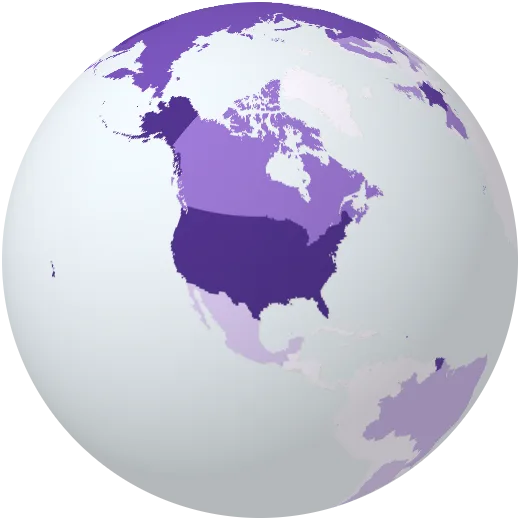
Nuclear power generated
Electricity generated by nuclear plants in a year.
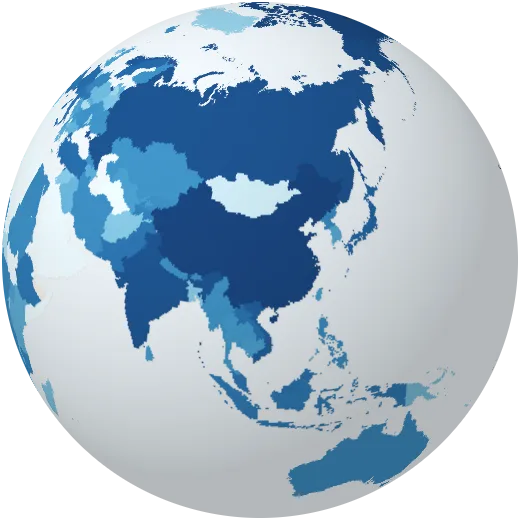
Hydropower generated
Electricity generated by dams and rivers in a year.
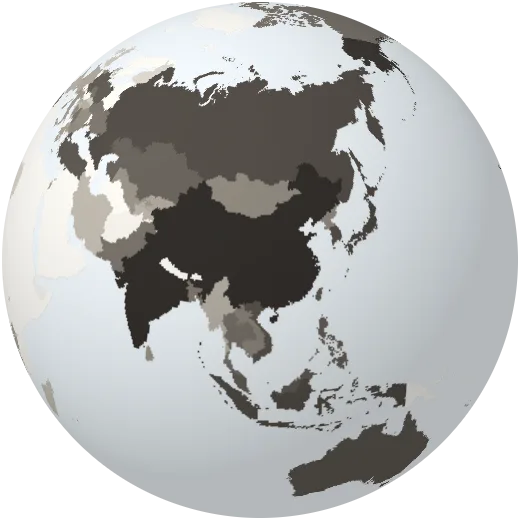
Coal power generated
Electricity generated by coal plants in a year.
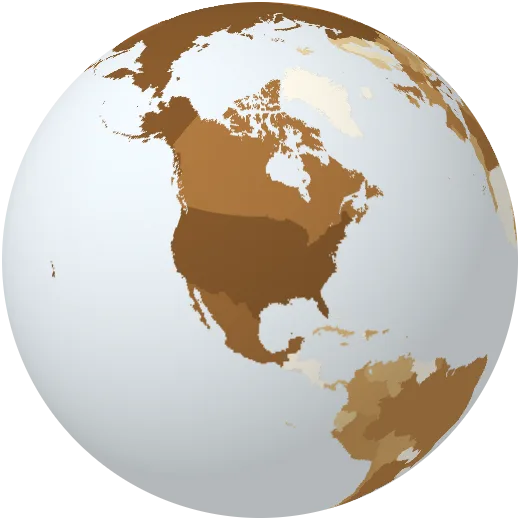
Gas power generated
Electricity generated by gas plants in a year.
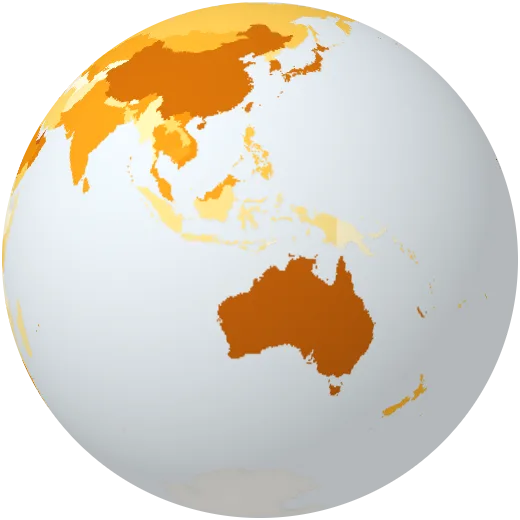
Solar power per person
Solar electricity generated per person each year.
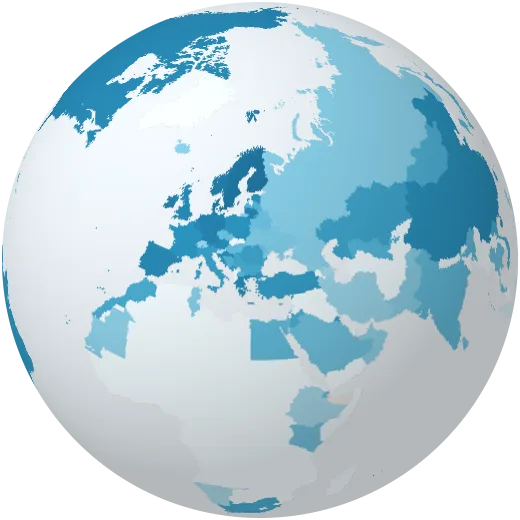
Wind power per person
Wind electricity generated per person each year.
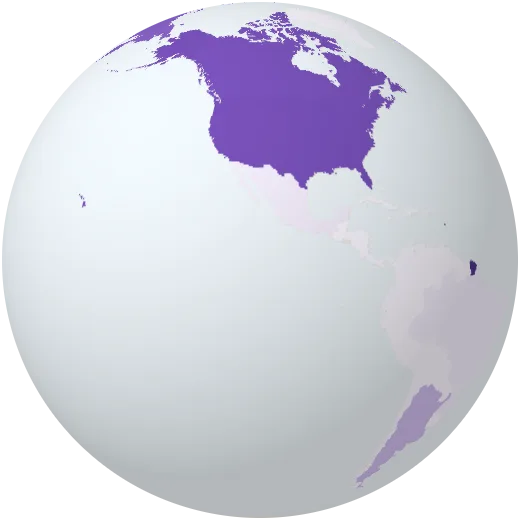
Nuclear power per person
Nuclear electricity generated per person each year.
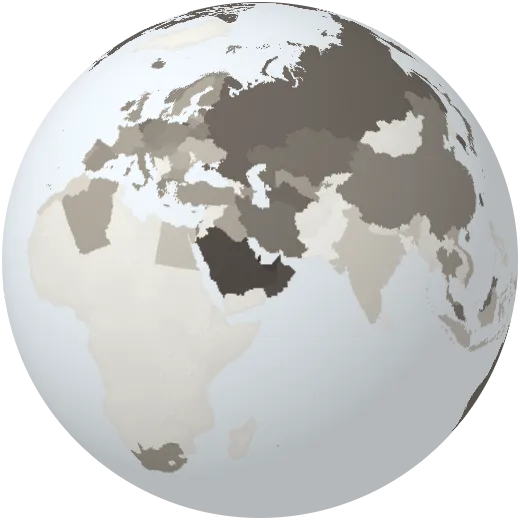
Fossil energy per person
Oil, gas and coal used per person each year.
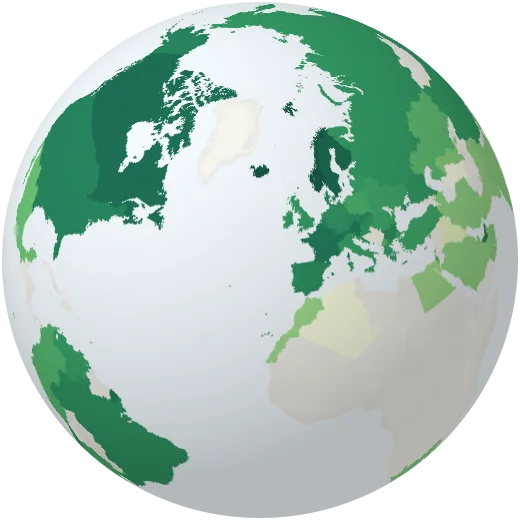
Low-carbon energy per person
Renewable and nuclear energy used per person each year.
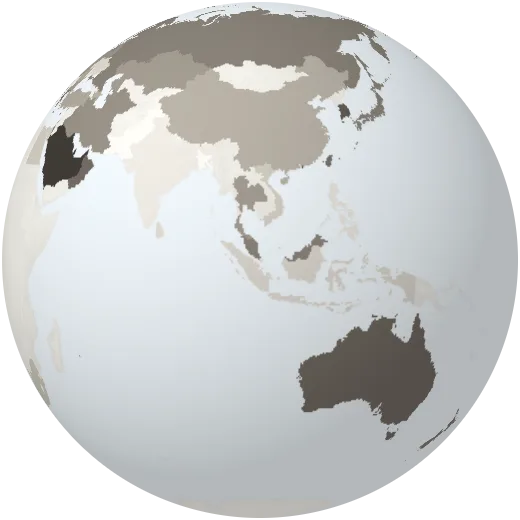
Oil use per person
Oil used per person each year, measured as energy.
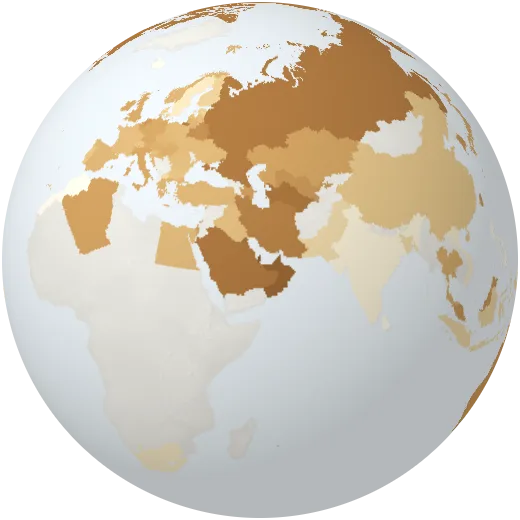
Gas use per person
Natural gas used per person each year, measured as energy.
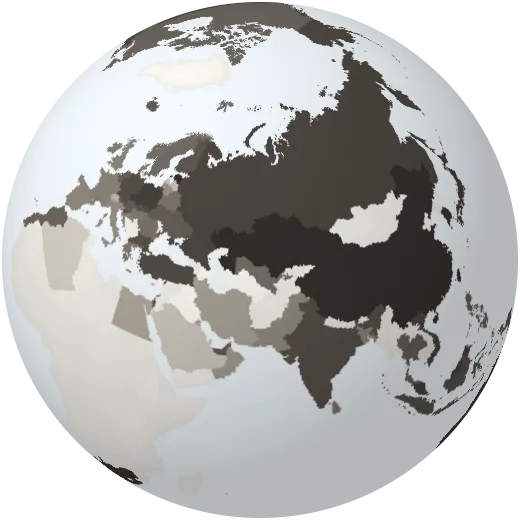
Coal use per person
Coal used per person each year, measured as energy.
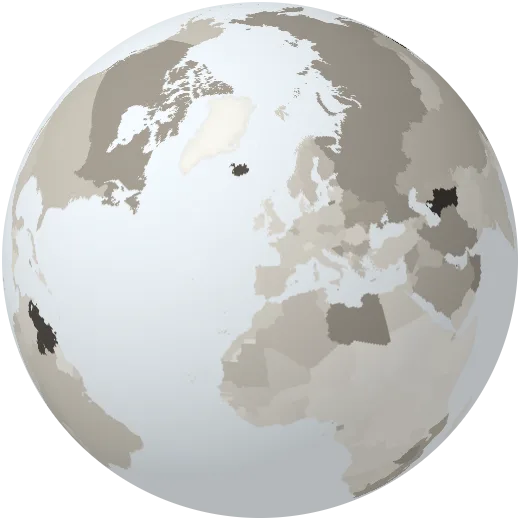
Energy per dollar
Energy used for each dollar of economic output.
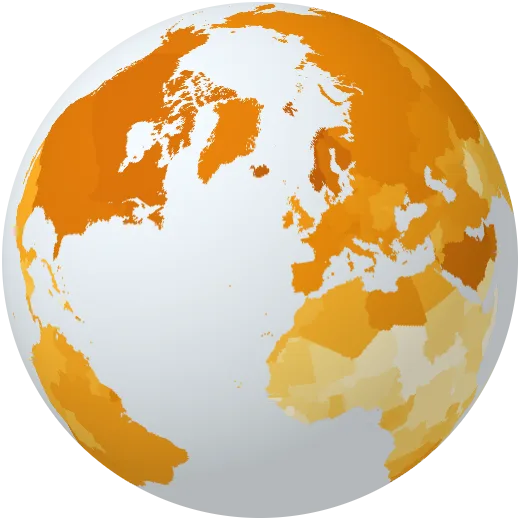
Electricity demand per person
Electricity used per person each year, including imports.
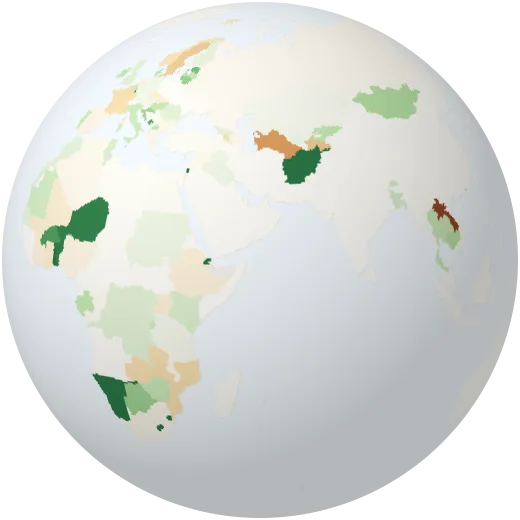
Electricity imports
Share of electricity bought from neighbours. Negative means the country sells power abroad.
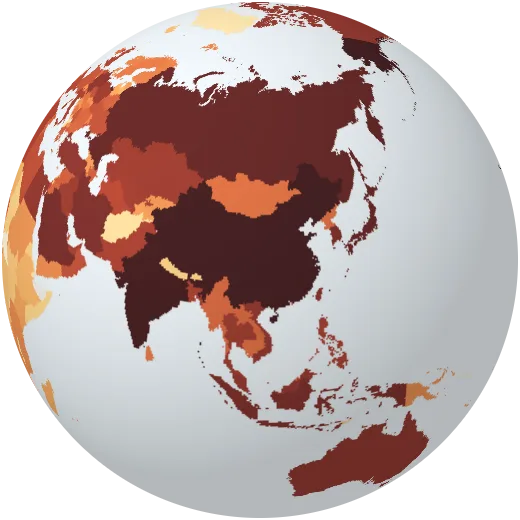
Emissions from electricity
Greenhouse gases released by making electricity.
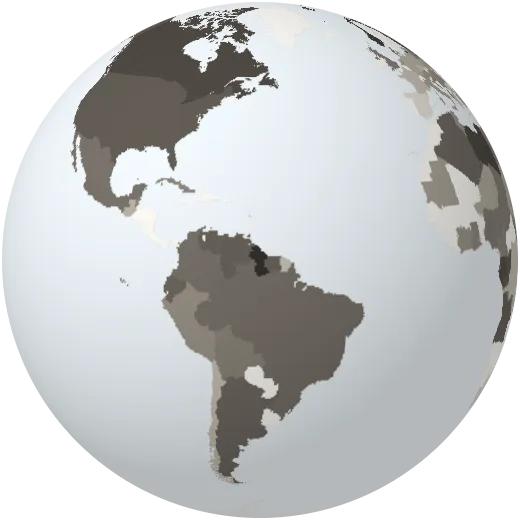
Oil production per person
Oil pumped per person each year, measured as energy.
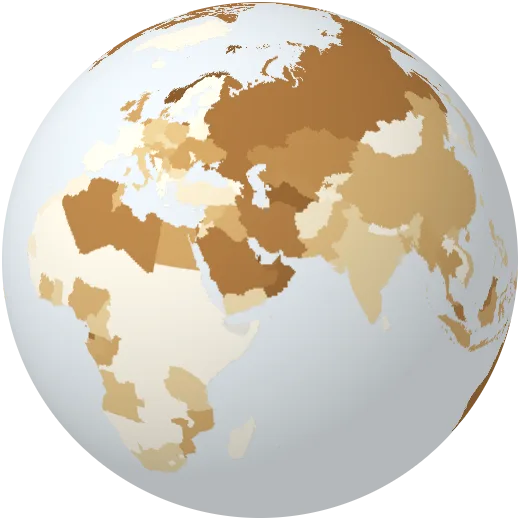
Gas production per person
Natural gas produced per person each year, measured as energy.
Change
Emissions, warming, forest loss and the pressure we put on the planet.
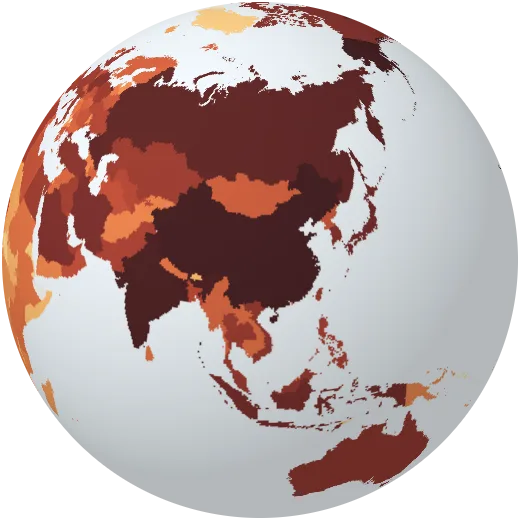
CO₂ emissions
Carbon dioxide from fossil fuels and industry each year. China emits the most today; the United States has emitted the most in total.
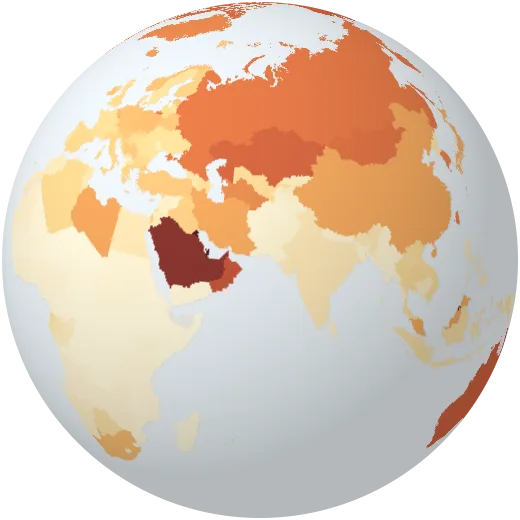
CO₂ per person
Each person’s share of their country’s CO₂ emissions. The world average is about 4.7 tonnes a year.
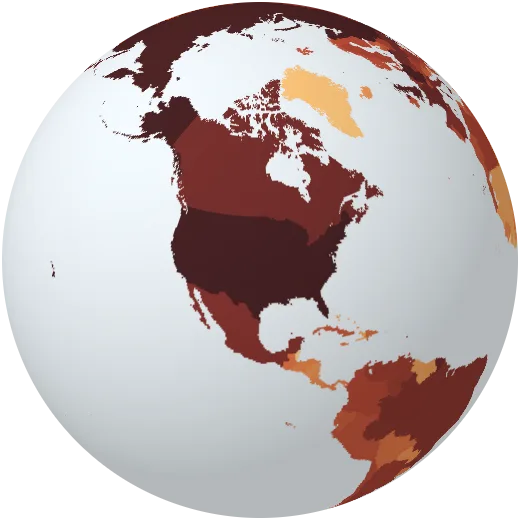
Historic CO₂
All CO₂ each country has emitted since 1750. It is the total, not the yearly rate, that sets how much the planet warms.
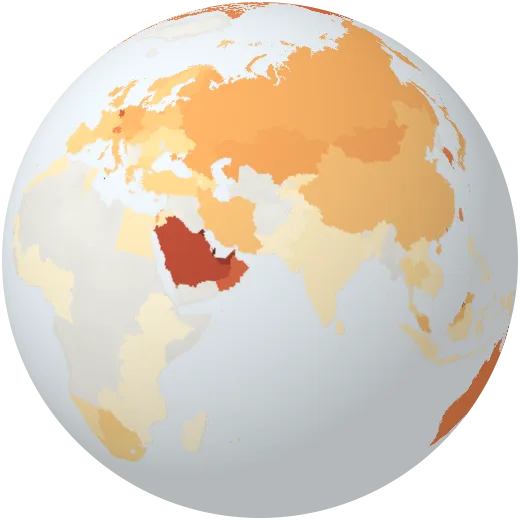
CO₂ of what we buy
Emissions per person counted where goods are consumed rather than where they are made, so imports count against the buyer.
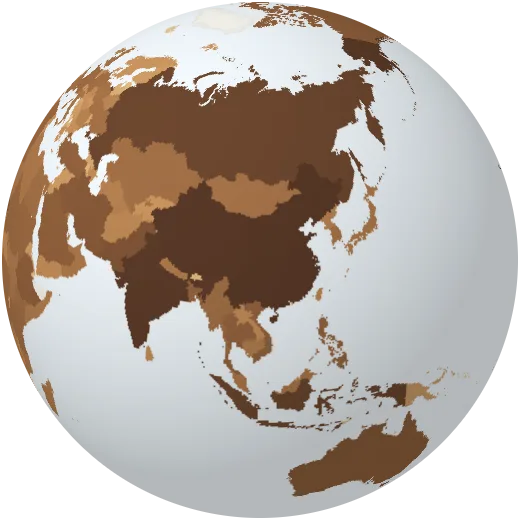
Methane emissions
Methane from farming, landfill, coal mines and oil and gas. It traps more than 80 times as much heat as CO₂ over 20 years.
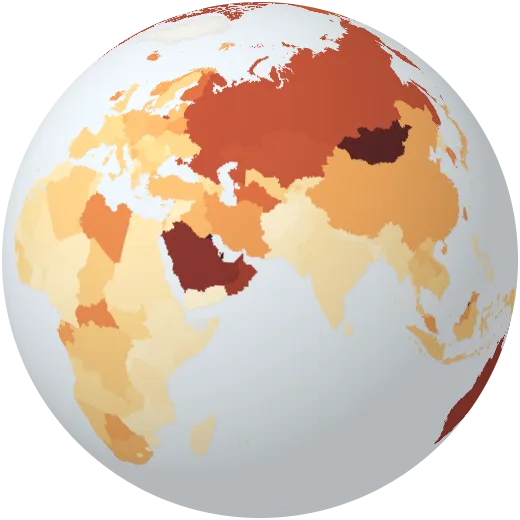
Greenhouse gases per person
All greenhouse gases per person, including methane, nitrous oxide and land use, converted to CO₂ equivalents.
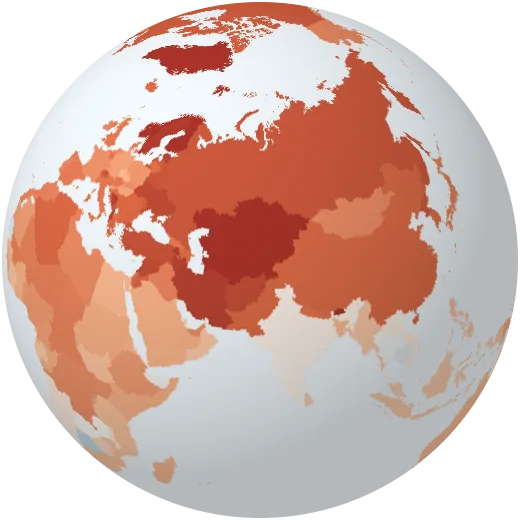
Warming
How much warmer or cooler each year was than the 1991–2020 average, country by country, from 1940. Press play to watch the colours turn.
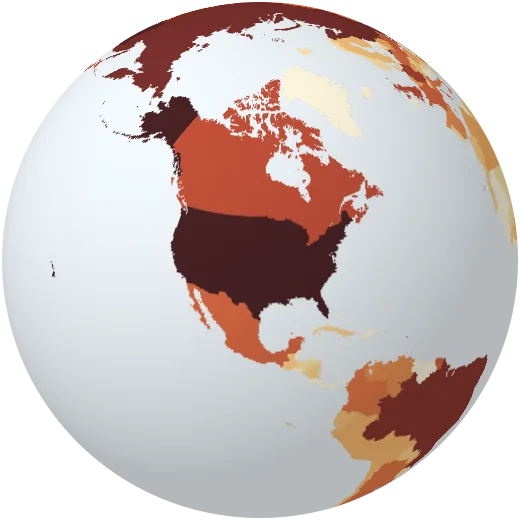
Contribution to warming
How much each country’s emissions of CO₂, methane and nitrous oxide since 1850 have warmed the planet.
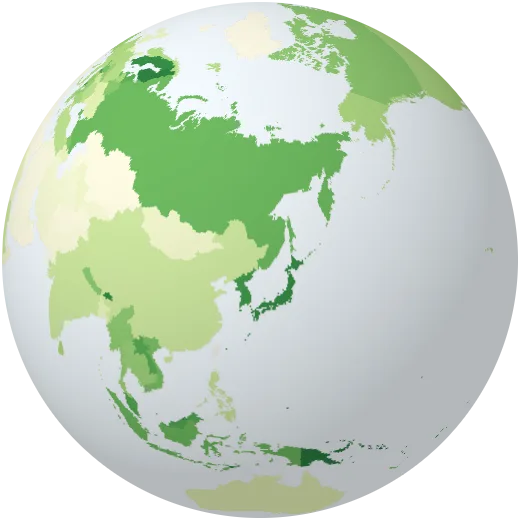
Forest cover by country
Share of each country covered by forest, every year since 1990. Suriname and Gabon are more than 90% forest; Egypt and Qatar almost none.
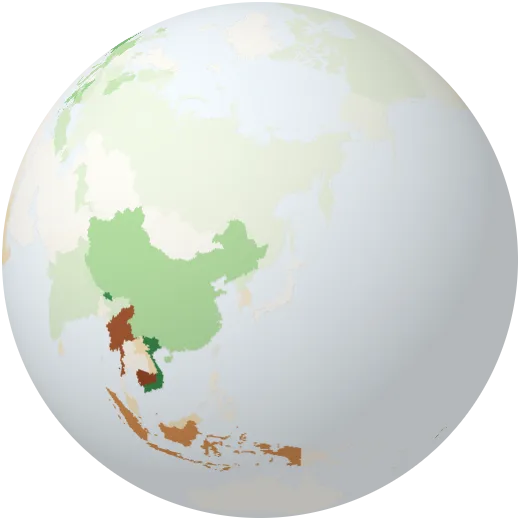
Forest gained and lost
Change in forest cover since 1990, in percentage points of land. Brown countries lost forest; green ones gained it.
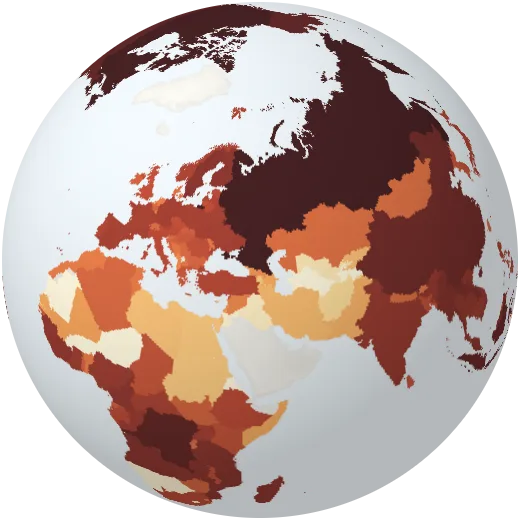
Tree cover loss
Trees cleared or burned each year since 2001, from Landsat satellite images. Brazil, Russia and Canada lose the most.
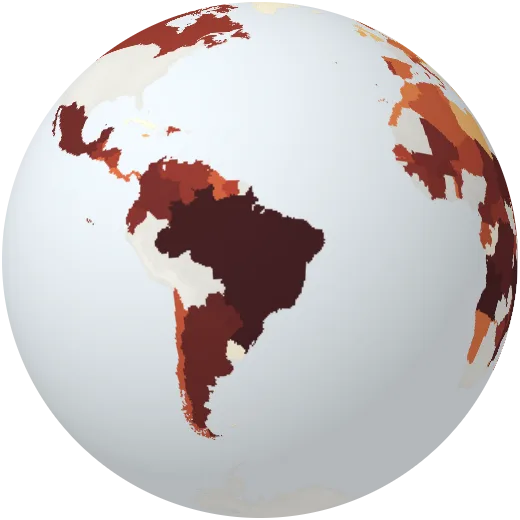
Deforestation
Forest permanently converted to other land use, mostly farmland, per year by decade.
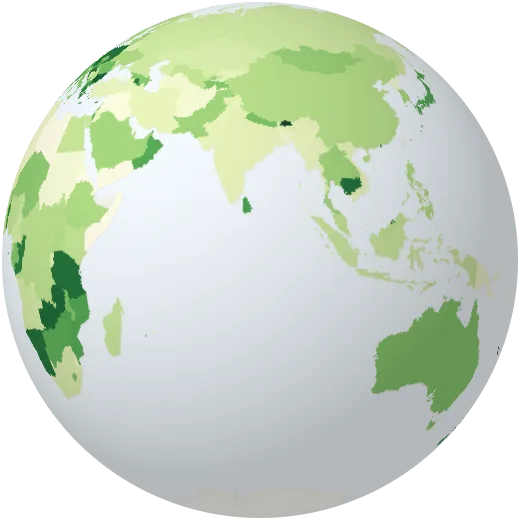
Protected land
Share of each country’s land in national parks and other protected areas. The world agreed in 2022 to protect 30% by 2030.
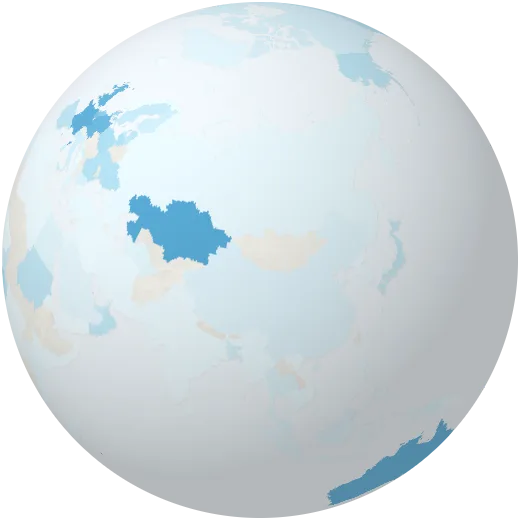
Protected sea
Share of each country’s waters that are marine protected areas.
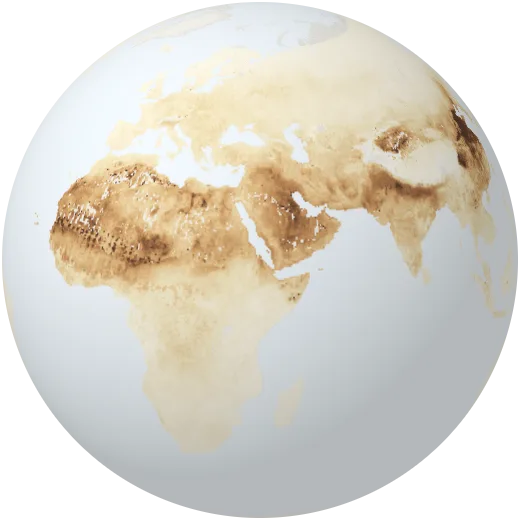
Air pollution
Fine particles (PM2.5) in the air we breathe, 2010–2012. The WHO guideline is 5 µg/m³; most people breathe several times more.
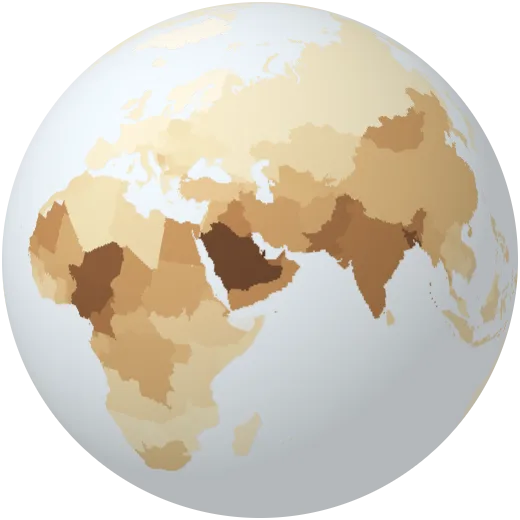
Air pollution by country
Average yearly exposure to fine particles for the people of each country.
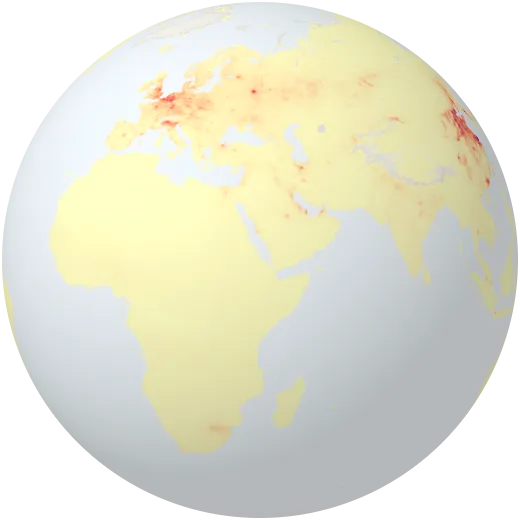
Nitrogen dioxide
Nitrogen dioxide near the ground, 2010–2012: a gas from car exhausts, power plants and industry that marks busy cities and roads.
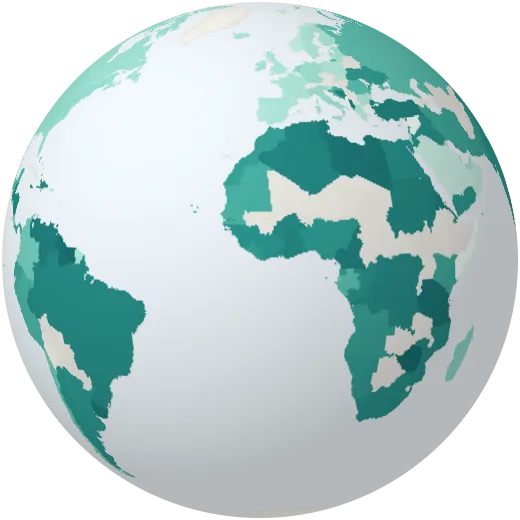
Plastic waste
Plastic waste that is not properly collected or treated and can end up in rivers and the sea, per person.
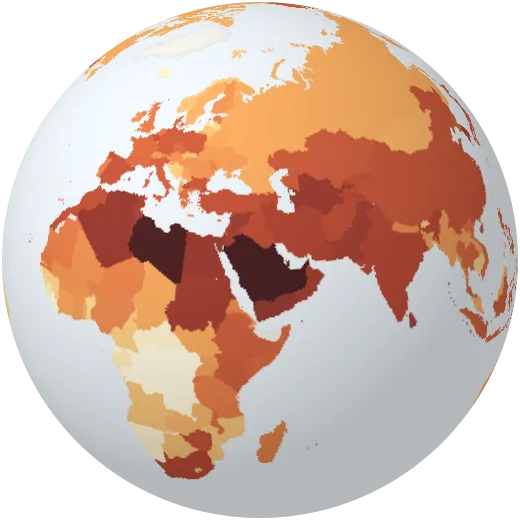
Water stress
Fresh water taken out each year as a share of the renewable supply. Above 100%, a country is drawing down its groundwater.
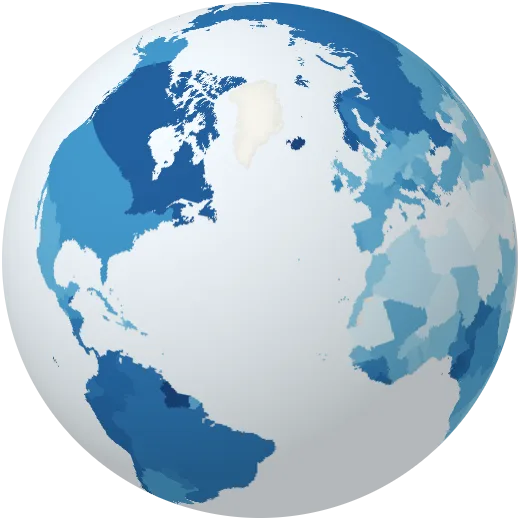
Fresh water per person
Renewable fresh water from rivers and groundwater available per person each year.
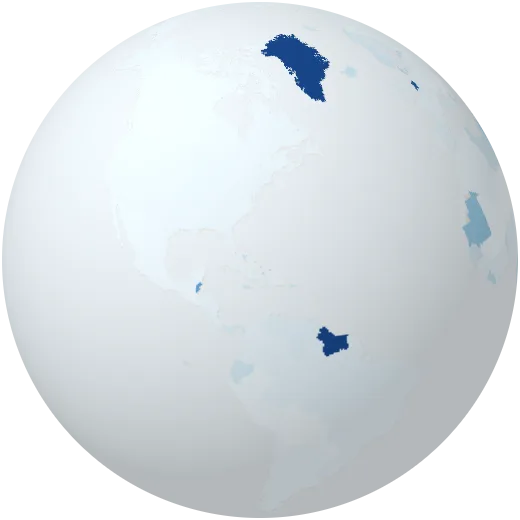
Sea level risk
Share of each country’s people living less than 5 metres above sea level, most exposed to rising seas and storm surges.
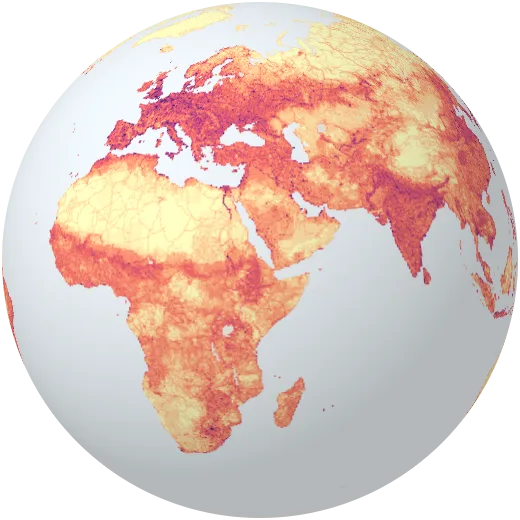
Human footprint
How strongly people shape the land: population, roads, farms, lights and buildings combined into one index from 0 to 100.
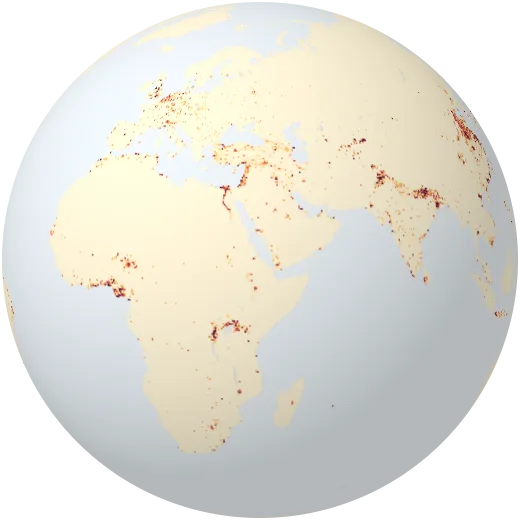
Urban expansion to 2030
Probability that land will become urban between 2000 and 2030, as cities spread into farmland and forest.
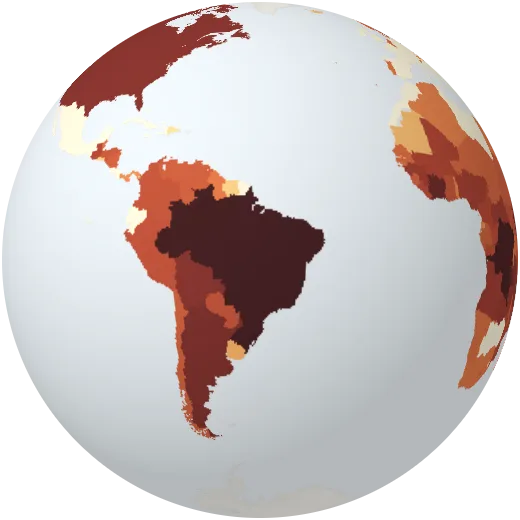
CO₂ from land use
CO₂ released when forests are cleared and land is converted, mostly in the tropics.
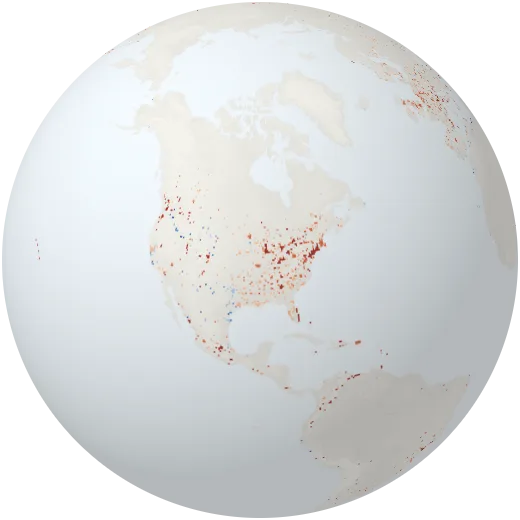
Urban heat islands
How much hotter cities are than the countryside around them on summer days, from satellite surface temperatures (2013). Concrete and asphalt can add several degrees.
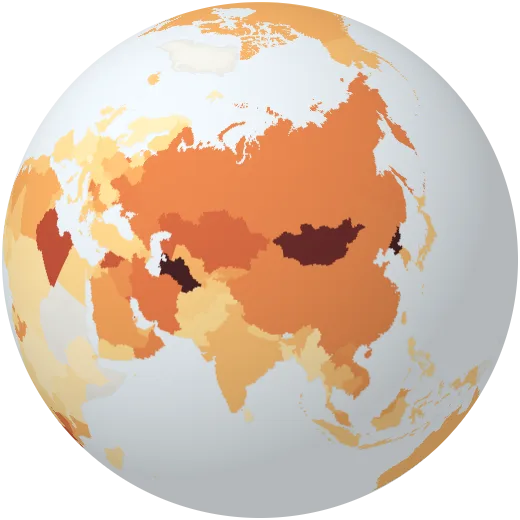
Carbon intensity of the economy
CO₂ emitted for each dollar of economic output (in 2011 prices, adjusted for purchasing power).
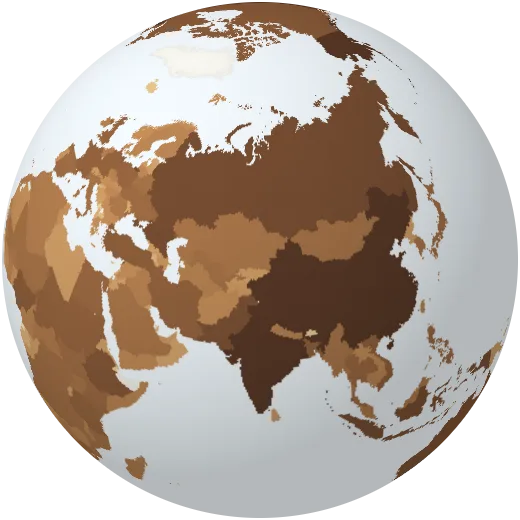
Nitrous oxide emissions
Nitrous oxide, mostly from fertiliser and manure. It traps about 270 times as much heat as CO₂ over a century.
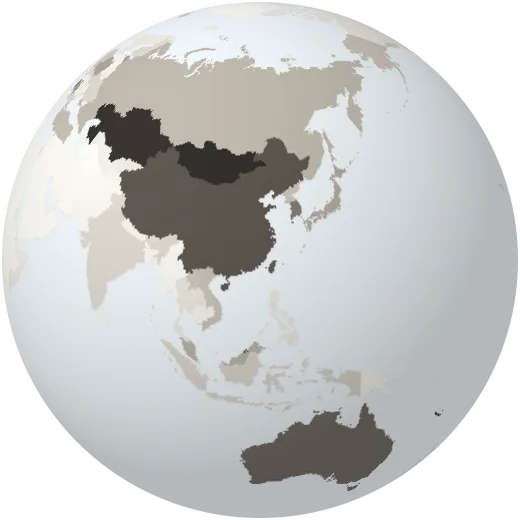
CO₂ from coal
Carbon dioxide from burning coal, per person.
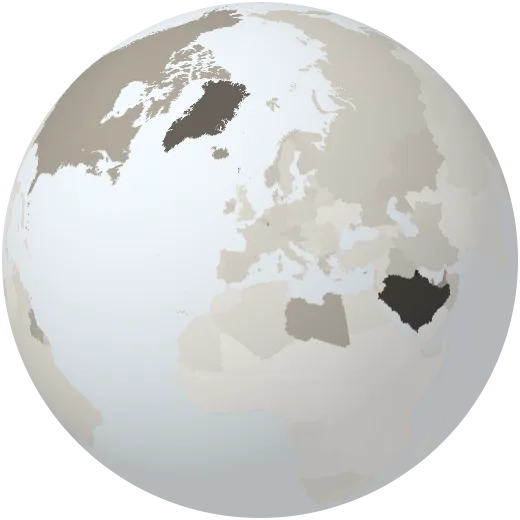
CO₂ from oil
Carbon dioxide from burning oil, per person.
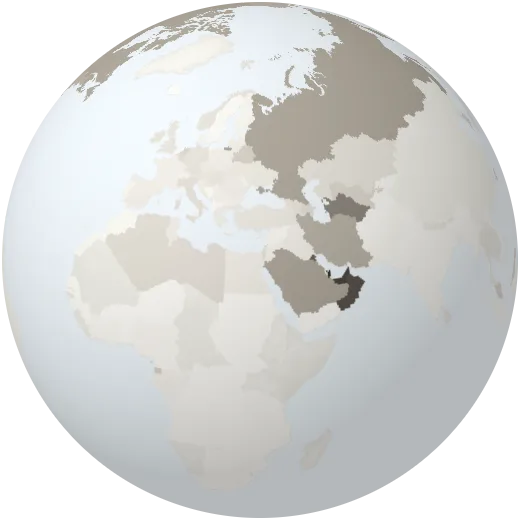
CO₂ from gas
Carbon dioxide from burning natural gas, per person.
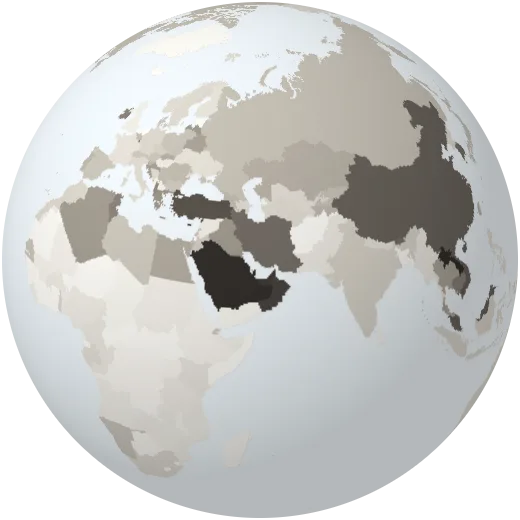
CO₂ from cement
Carbon dioxide released when making cement, per person.
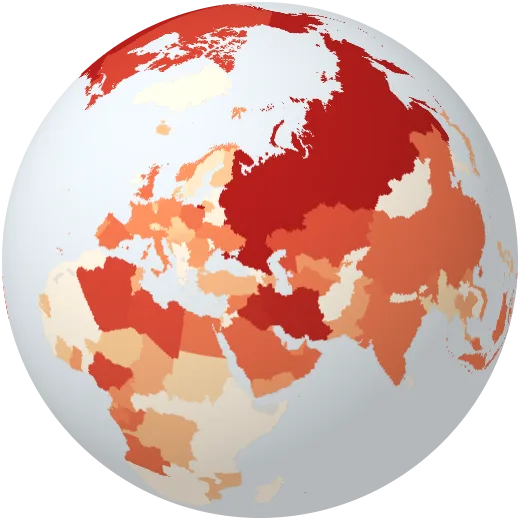
Gas flaring
Carbon dioxide from gas burned off at oil wells instead of being used.
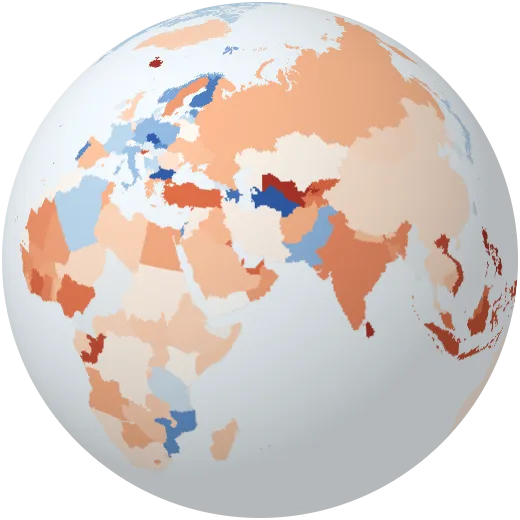
Change in CO₂
How much a country’s CO₂ emissions rose or fell compared with the year before.
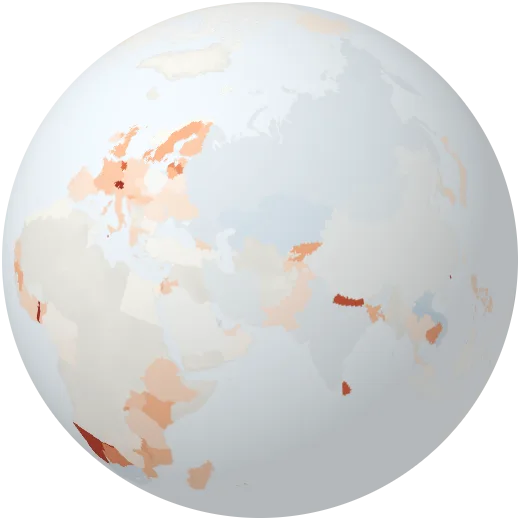
CO₂ in trade
Positive: the country imports goods whose CO₂ was emitted elsewhere. Negative: it emits CO₂ for goods used abroad.
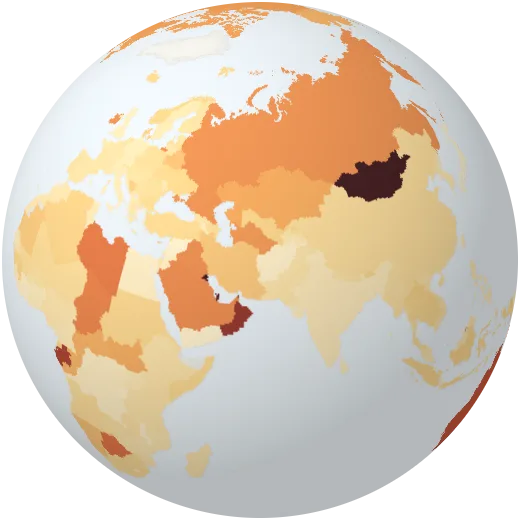
Methane per person
Methane from farming, fossil fuels and waste, per person, in CO₂ equivalents.
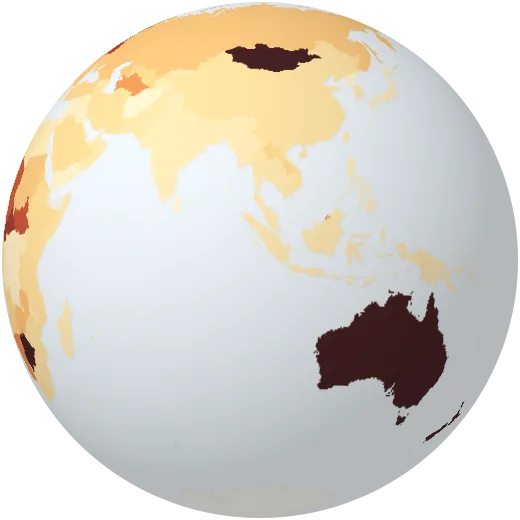
Nitrous oxide per person
Nitrous oxide, mostly from fertiliser, per person, in CO₂ equivalents.
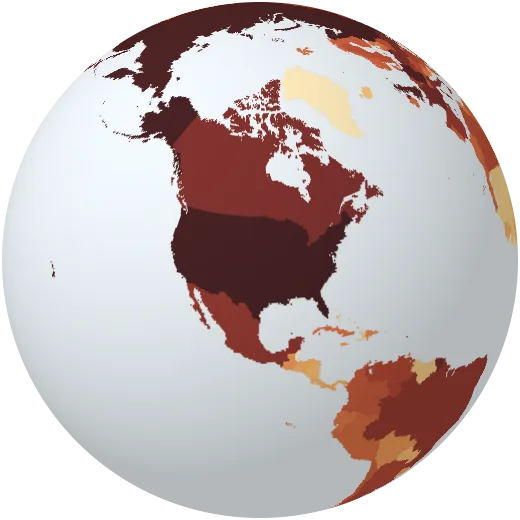
Share of historic CO₂
Each country’s share of all fossil CO₂ emitted since the industrial revolution.
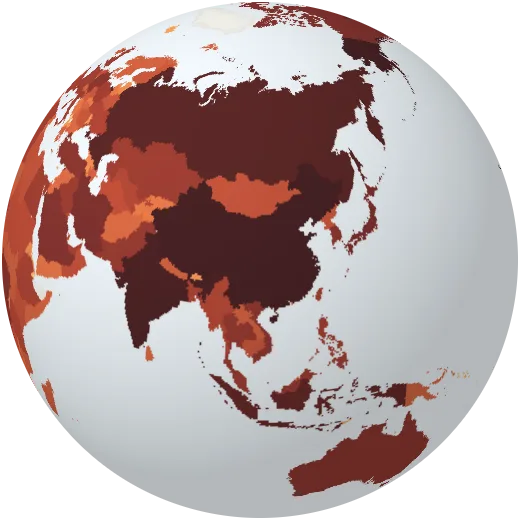
All greenhouse gases
All greenhouse gases a country emits in a year, including land use.
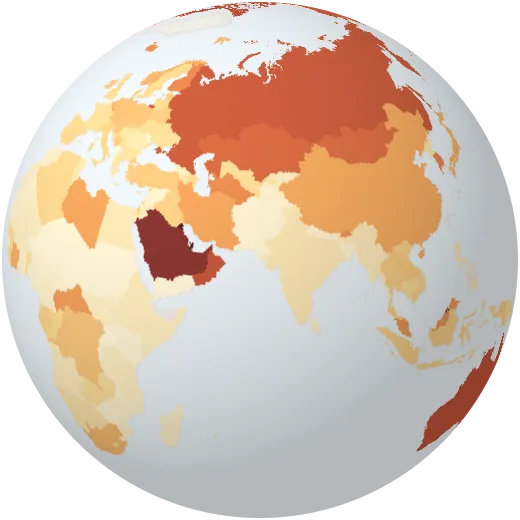
CO₂ including forests
CO₂ per person including emissions from cutting and burning forests.
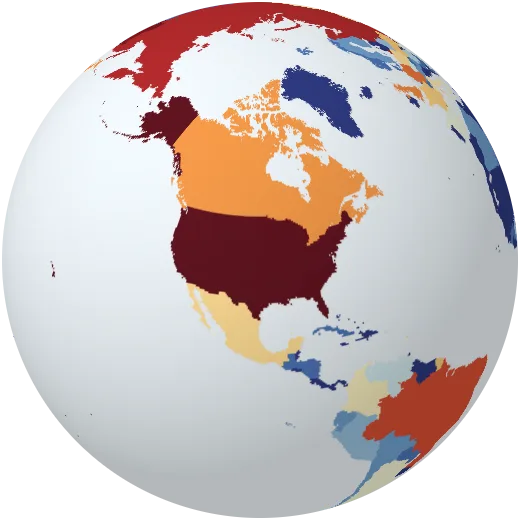
Warming caused by CO₂
How much each country’s CO₂ has warmed the planet so far.
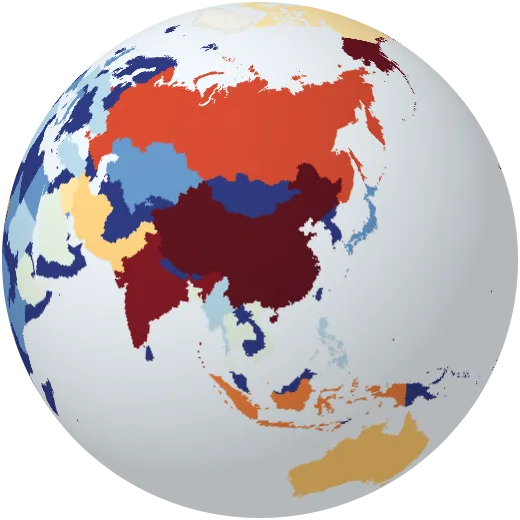
Warming caused by methane
How much each country’s methane has warmed the planet so far.
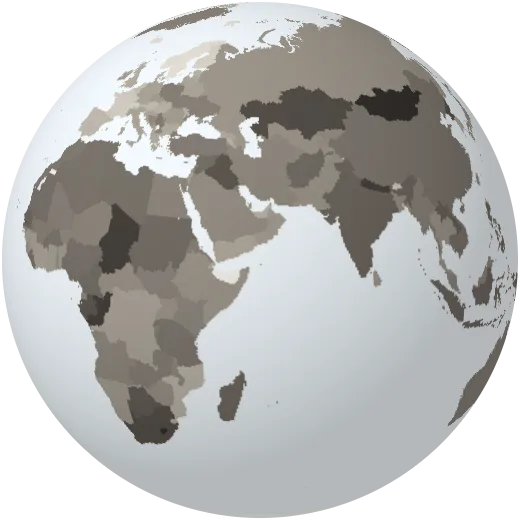
Carbon in energy
CO₂ released for each unit of energy used. Lower means cleaner energy.
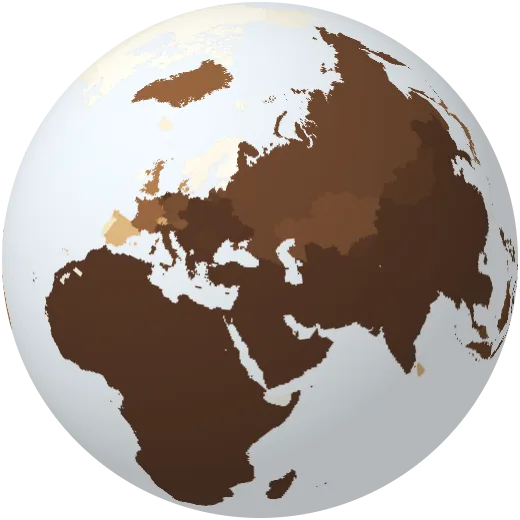
Breathing unsafe air
Share of people exposed to fine dust above the WHO guideline.
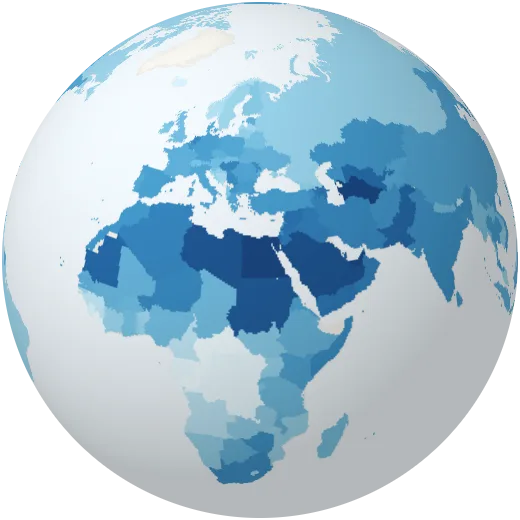
Water use
Fresh water taken each year as a share of what nature replenishes.
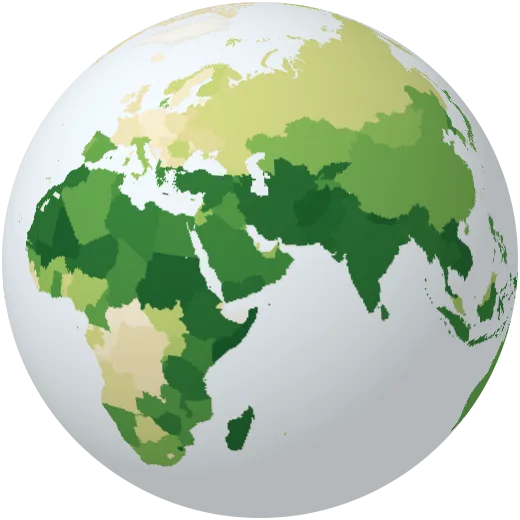
Water for farming
Share of fresh water used for farming.
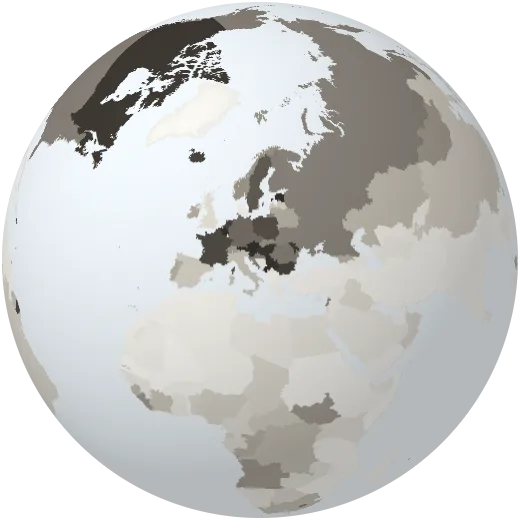
Water for industry
Share of fresh water used by industry and power plants.
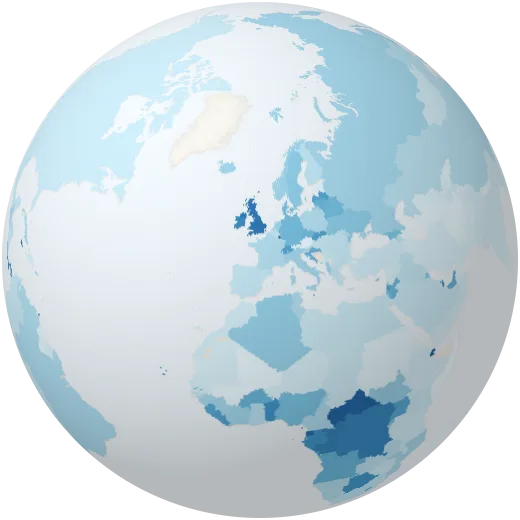
Water for homes
Share of fresh water used in homes and towns.
Hazards
Earthquakes, volcanoes, fires, storms, floods and droughts.
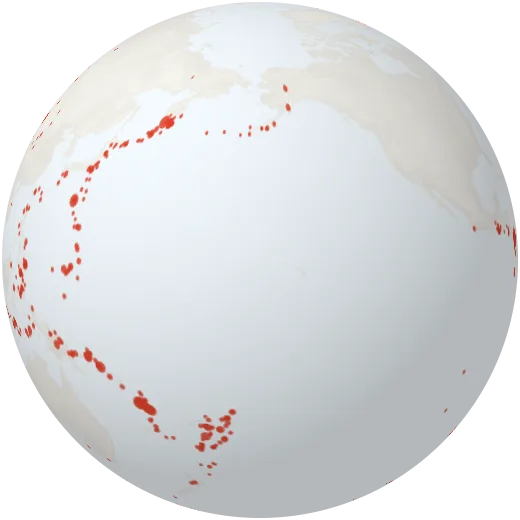
Earthquakes
Every earthquake of magnitude 4.5 or more in the past 30 days, from the USGS live feed. Most line up along plate boundaries.
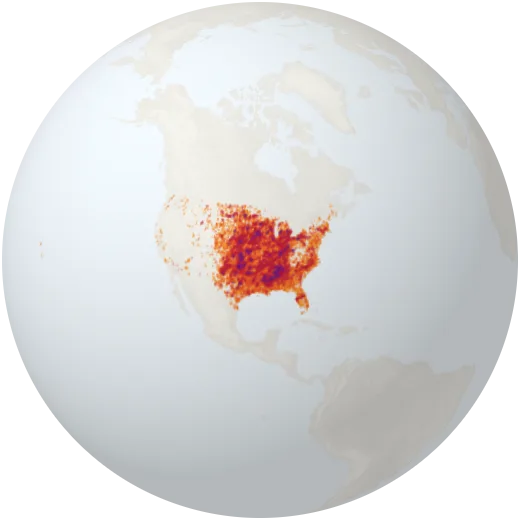
Tornado paths
The path of every tornado of strength EF1 or more recorded in the United States since 1950, coloured from EF1 (yellow) to EF5 (purple). The US gets more tornadoes than any other country: about 1,200 a year.
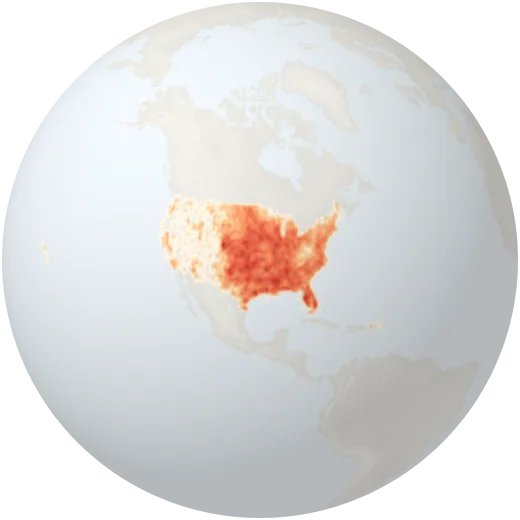
Tornado frequency
How often tornadoes cross each area of the United States, per 10,000 km² per year (1950–2023). Tornado Alley in the Great Plains and Dixie Alley in the South stand out.
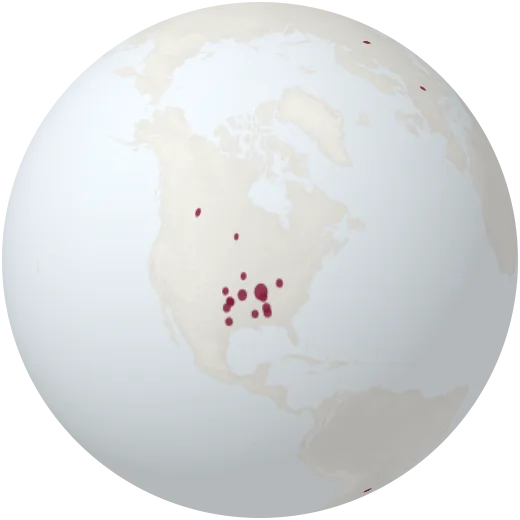
Historic tornadoes
Famous tornadoes around the world, from the deadliest ever in Bangladesh to the widest, the fastest and the strongest. Click one to read its story.
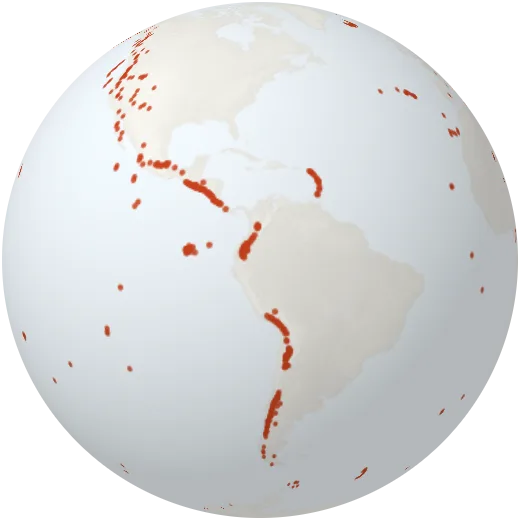
Volcanoes
More than 1,200 volcanoes that have erupted in the last 12,000 years. Most of them line the Pacific Ring of Fire.
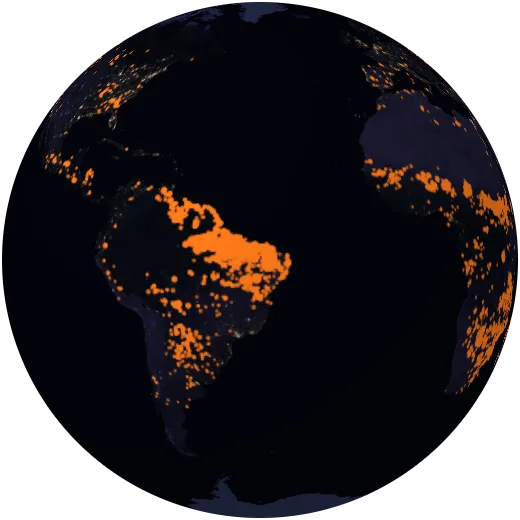
Wildfires
Active fires detected by satellites in the last 24 hours, from NASA FIRMS. Most are farm and grassland burning; some are forest fires.
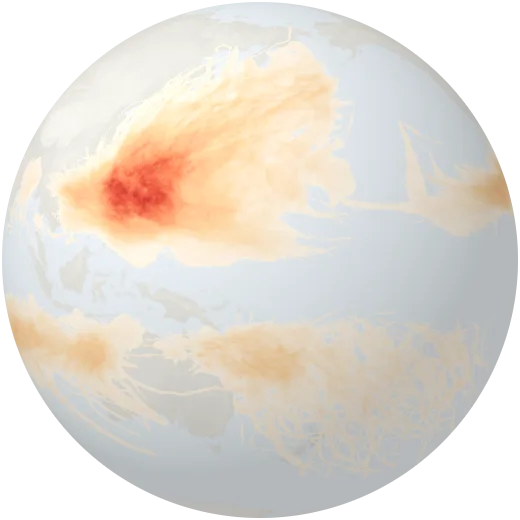
Tropical cyclones
How often tropical cyclones — hurricanes and typhoons — passed over each area between 1980 and 2000.
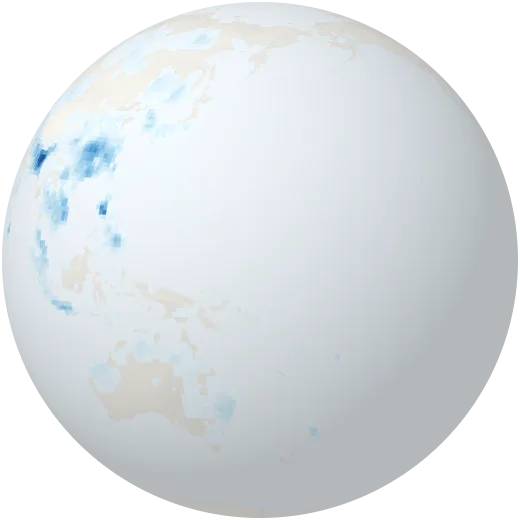
Floods
How often large floods were recorded in each area between 1985 and 2003.
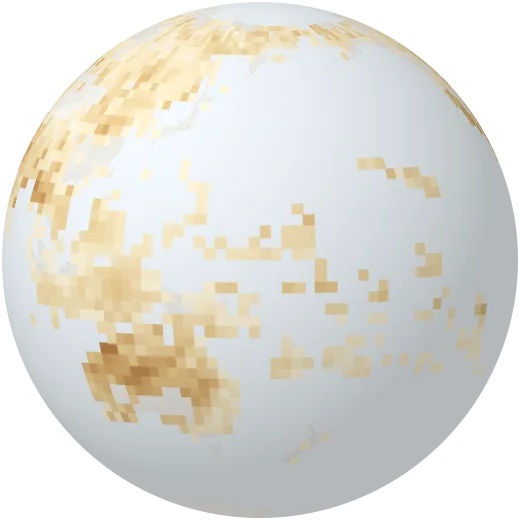
Droughts
How often droughts struck each area between 1980 and 2000.
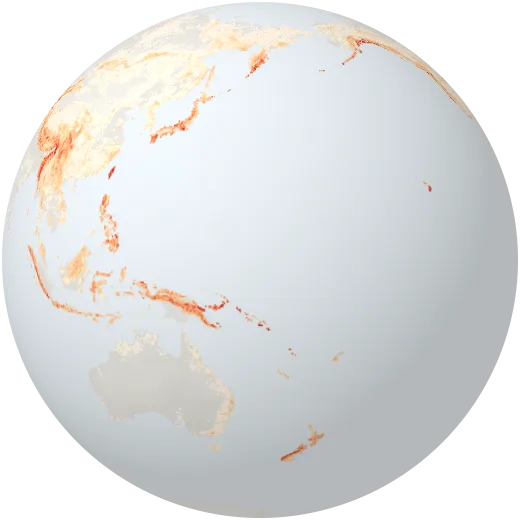
Landslides
Landslide hazard from slope, soil, rainfall and earthquakes, from low to very high.
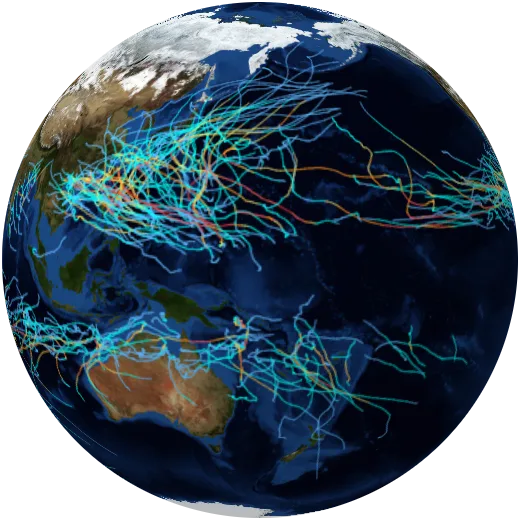
Hurricane tracks
The path of every tropical storm, hurricane and typhoon of the last three years, coloured by wind speed (IBTrACS).